Customer satisfaction metrics have become the backbone of modern support operations. According to research, satisfied customers generate 2.4x more revenue growth compared to dissatisfied ones, and companies with strong satisfaction scores see retention rates that directly impact their bottom line. In 2026, 89% of unhappy customers will simply leave without voicing concerns, making proactive measurement critical.
For SaaS and B2B teams, these metrics reveal exactly where your support experience succeeds and where it falls short. The challenge is knowing which KPIs deserve your attention and how to collect meaningful data without overwhelming your team. This guide breaks down the metrics that matter, shows you how to measure them, and explains how to turn those numbers into lasting customer loyalty.
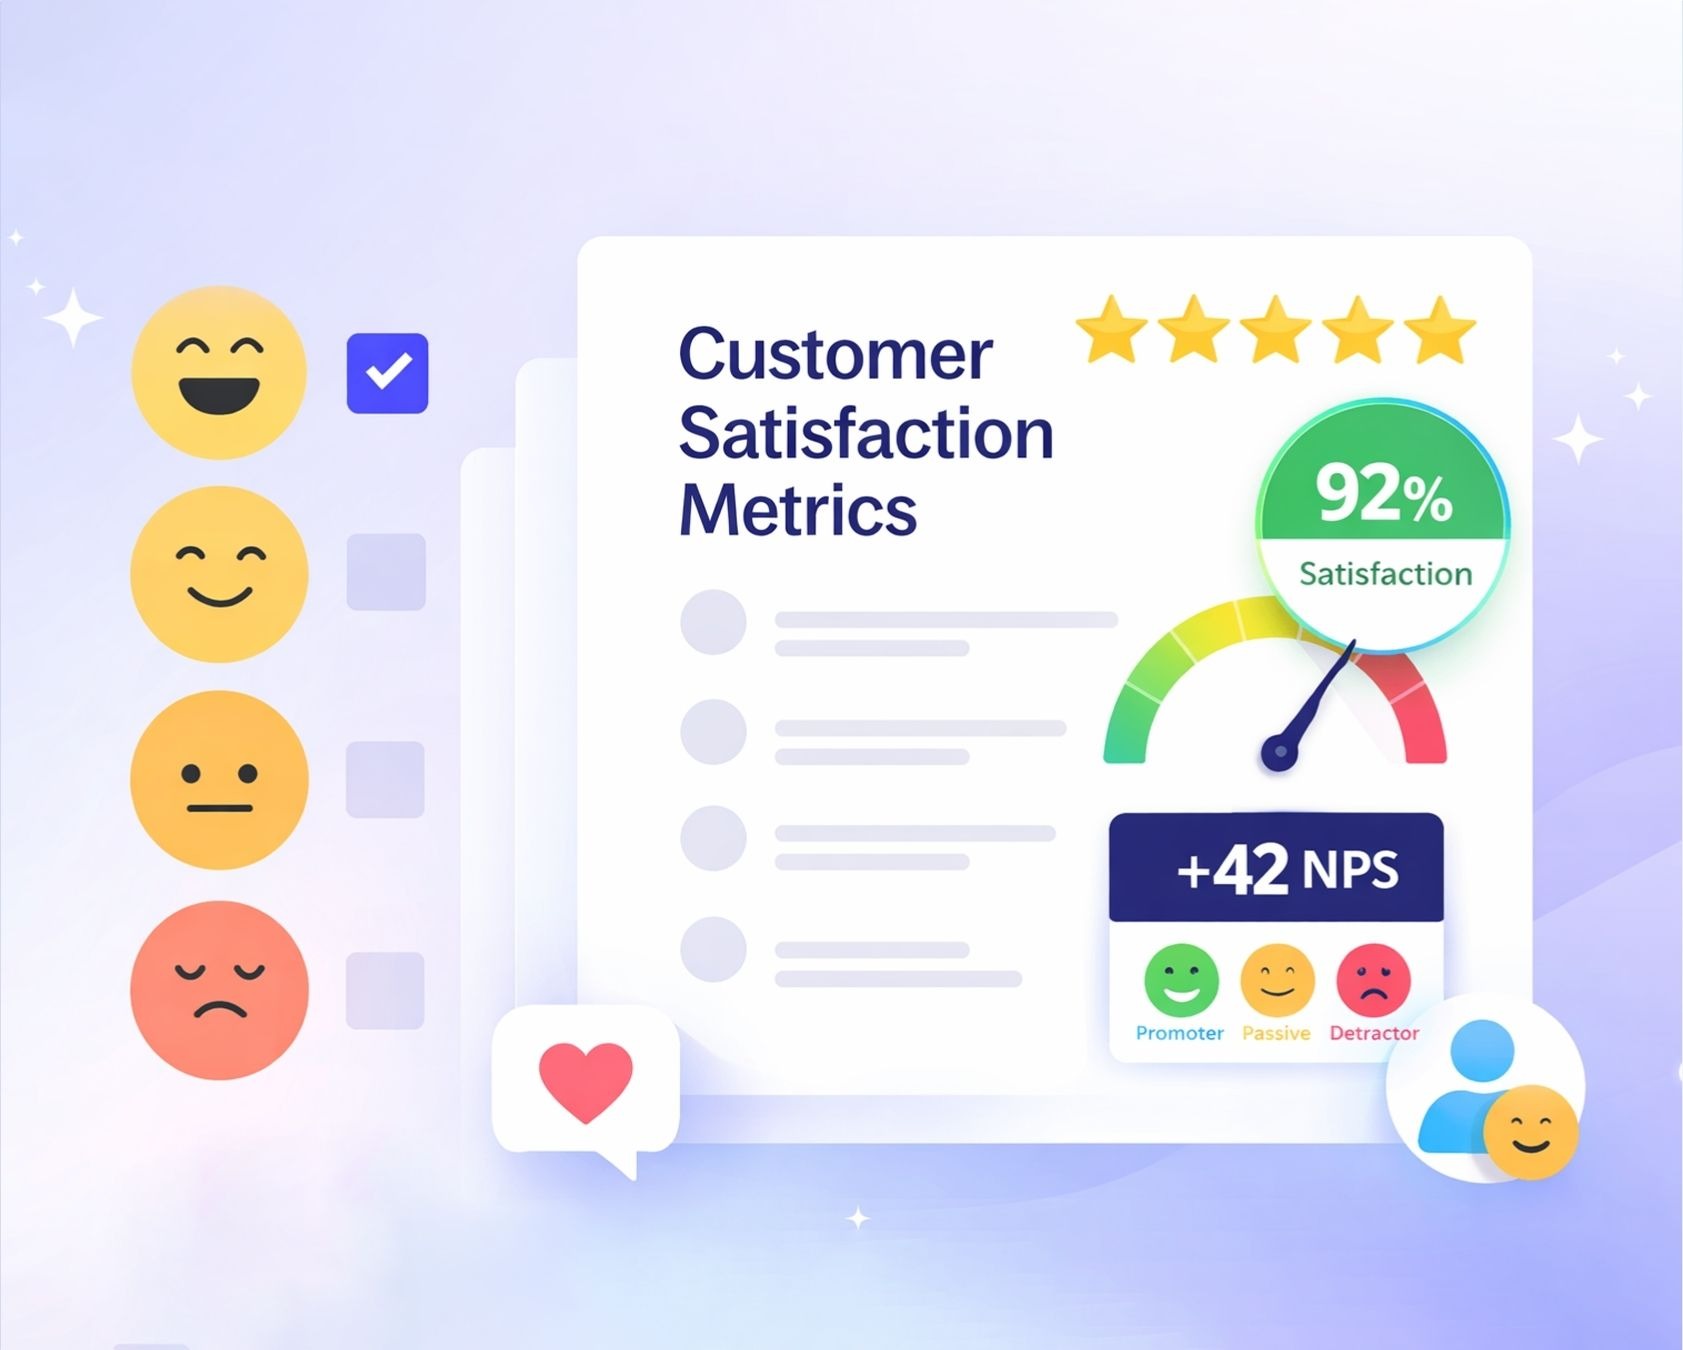
What Are Customer Satisfaction Metrics?
Customer satisfaction metrics are quantifiable ways to track how happy customers feel about your product, support interactions, and overall experience. They take subjective feelings and turn them into numbers you can monitor across months, quarters, and years.
For SaaS businesses and support teams, these metrics provide clarity. Instead of guessing whether customers perceive your service positively, you get concrete data. A customer satisfaction score of 87% tells you something specific. A net promoter score of 45 gives you a benchmark to improve against.
No single KPI tells the full story. Leaders typically combine 3 to 7 metrics to cover different aspects of the customer experience. Sentiment metrics like CSAT and NPS capture how customers feel. Effort metrics like CES reveal friction points. Behavioral metrics like retention rate and customer churn rate show what customers do over time. Value metrics like customer lifetime value connect satisfaction to revenue.
For support-heavy businesses, ticket data now plays a central role in the satisfaction picture too. First response time, average resolution time, and first contact resolution rate act as leading indicators. When your support team resolves issues quickly and thoroughly, satisfaction scores tend to follow.
Why Measuring Customer Satisfaction Metrics Matters in 2026
Customer expectations have shifted dramatically. In 2026, fast replies, always-on support, and frictionless self-service are baseline requirements rather than competitive advantages. Your target audience expects answers in minutes on live chat and within hours via email. Falling short means losing customers to competitors who deliver.
Tracking satisfaction metrics reduces churn by revealing early warning signs before they become cancellations. A slipping NPS after a product release signals trouble. Rising complaint volume indicates friction. Lower CSAT scores on specific touchpoints show exactly where the customer journey breaks down. These signals give you time to respond.
The link between higher satisfaction and revenue growth is well documented. Research shows that a 5% increase in customer retention can meaningfully raise profit over a year because existing customers spend more and cost less to serve than new customers acquired through marketing. Loyal customers also drive repeat business and referrals, expanding your customer base without additional acquisition costs.
Metrics guide resource allocation decisions. Should you invest more in automation or hire additional agents? Which features should you prioritize on your roadmap? Satisfaction data provides the answers. When you see that customers interactions with your knowledge base correlate with higher CES scores, you know where to focus.
There is a cultural impact too. When your customer service team sees satisfaction KPIs in their daily dashboards, they naturally start making more customer-centric decisions. The metrics create accountability and align everyone around shared goals.
Core Customer Satisfaction Metrics To Track
This section covers the most widely used important customer satisfaction metrics and explains when each works best for SaaS and support teams. Understanding these four key metrics gives you a foundation for measuring satisfaction effectively.
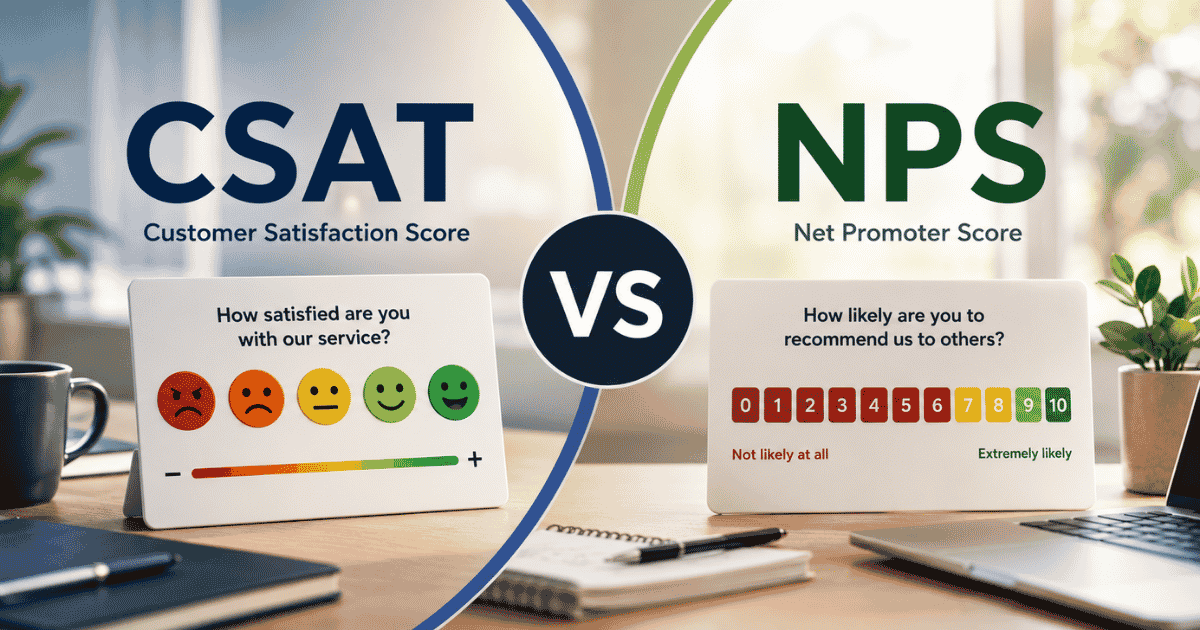
Customer Satisfaction Score (CSAT)
CSAT is the most direct measure of immediate satisfaction after a specific interaction. It typically asks customers to rate their experience on a 1 to 5 or 1 to 10 scale right after a support ticket closes, onboarding finishes, or a purchase completes.
The formula is straightforward. Take the number of positive ratings (4s and 5s on a 5-point scale), divide by total responses, and multiply by 100 to get your percentage. If 85 out of 100 customers rate you 4 or 5, your CSAT is 85%.
CSAT works best when you want to evaluate specific touchpoints. Use it after support tickets close, after onboarding wraps up, or after a feature launches. The key is timing. Send the survey within minutes or hours while the experience is fresh.
A sample question might be: “How satisfied were you with the support you received today?” followed by a simple 1 to 5 scale. Top performers in e-commerce and SaaS typically hit 80% to 90% CSAT, while averages hover around 75% for support interactions.
Net Promoter Score (NPS)
Net promoter score nps measures customer loyalty through one core question: “On a scale of 0 to 10, how likely are you to recommend us to a friend or colleague?”
Responses segment into three groups. Promoters score 9 or 10 and are your most loyal customers. Passives score 7 or 8 and are satisfied but not enthusiastic. Detractors score 0 to 6 and may spread negative feedback about your brand.
Calculate NPS by subtracting the percentage of detractors from the percentage of promoters. If 50% are promoters and 20% are detractors, your NPS is 30. World-class companies like Apple report NPS around 70, while industry averages vary significantly. B2B SaaS companies often aim for 30 or higher as a strong benchmark.
NPS works best at the relationship level rather than after single interactions. Send it quarterly or semi-annually to active customers to track overall satisfaction levels and brand loyalty over time. Adding one follow-up open question like “What is the main reason for your score?” captures the why behind the number and provides valuable insights for improvement.
Customer Effort Score (CES)
Customer effort score ces measures how easy it is for customers to complete a task like resolving an issue, changing a plan, or finding an answer in your knowledge base. Lower effort correlates strongly with higher loyalty and customer retention.
The typical question asks: “How easy was it to get your issue resolved today?” on a scale of 1 to 7, where 1 is very difficult and 7 is very easy. Calculate CES as the percentage of customers who agree the experience was easy (scores of 5, 6, or 7) or simply average all scores.
Gartner research found that customers with low-effort experiences are 94% less likely to churn compared to those who faced friction. This makes CES particularly valuable for improving customer retention and identifying pain points in your support workflows.
Survey customers right after a ticket closes or a chat session ends. If your CES falls below 70%, you likely have complex interfaces or confusing processes that need attention. SaaS companies often use CES to evaluate onboarding flows, where small reductions in effort can significantly impact whether new customers stick around.
Retention Rate and Churn Rate
Customer retention rate measures the percentage of customers who stay with you over a defined period. The formula is simple: take the number of customers at the end of the period, subtract new customers acquired during that period, divide by customers at the start, and multiply by 100.
Customer churn rate is the inverse. It tracks the percentage of customers lost through cancellations and non-renewals. For subscription businesses, monthly churn under 5% indicates healthy satisfaction levels. Rising churn above 7% signals issues that need immediate attention.
These metrics become powerful when combined with CSAT or NPS data. You can identify specific customer segments with low satisfaction and high churn, then investigate the root causes. A B2B SaaS company might discover that customers who scored low NPS in their first 90 days have 3x higher churn rates. That insight points directly to onboarding improvements.
Reducing churn saves significant money. Research shows it costs 5 to 25 times more to acquire new customers than to retain existing customers. Even small improvements in retention compound into meaningful revenue growth over time.
Customer Lifetime Value (LTV or CLV)
Customer lifetime value estimates the total revenue a customer generates over their entire relationship with your company, not just a single contract term. Higher satisfaction typically leads to higher LTV through renewals, expansions, and cross-sells.
For subscription and SaaS models, LTV combines average revenue per account, gross margin, and retention duration. Without diving into complex formulas, the key insight is this: loyal customers spend 67% more than new ones. When you improve satisfaction, you extend relationships and increase the revenue each customer contributes.
LTV also helps you understand how much you can invest in customer success and support. If your average customer lifetime value is $5,000, you can justify spending more on reducing churn and improving the customer experience than if LTV is only $500.
Support-Driven Metrics That Influence Satisfaction
Some operational KPIs act as leading indicators of satisfaction even though they are not satisfaction scores themselves. Your customer support team should track these alongside CSAT and NPS.
First response time measures how quickly a customer receives an initial reply. In 2026, happy customers expect responses within minutes on chat and within a few business hours via email. Average speed to answer below 20 seconds for phone support keeps frustration low. When response time increases, satisfaction typically decreases.
Average resolution time tracks how long it takes to resolve an issue from first contact to full closure. Faster resolutions correlate with higher CSAT and better CES scores. First-contact resolution measures the percentage of issues resolved in a single interaction without requiring follow-up. Higher FCR rates mean less effort for customers.
These metrics connect directly to your helpdesk tools, SLAs, and automation rules. When you set a 2-hour first response SLA and automate routing for priority tickets, you create the conditions for better satisfaction scores. The operational work drives the outcome.
How To Measure Customer Satisfaction Metrics Step by Step
Moving from “we should measure this” to a working system is simpler than it seems. Most teams can implement basic satisfaction tracking within a single quarter using these five steps.
1. Define Your Objectives and Customer Journeys
Start by deciding what you want to improve in the next 6 to 12 months. Are you focused on reducing onboarding churn? Improving post-ticket CSAT? Increasing overall NPS for your customer base? Clear objectives prevent you from collecting noisy data you will never use.
Map out your key customer journeys: trial to paid, onboarding, ongoing support, and renewal. Select one or two moments in each journey where capturing feedback makes sense. For a SaaS company, that might mean a CSAT survey after ticket resolution and an NPS survey 30 days after a customer upgrades to a paid plan.
Resist the urge to survey everywhere. Over-surveying creates fatigue and drives down response rates. Focus on the touchpoints that matter most for your current goals.
2. Design Focused Surveys
Short, focused surveys outperform lengthy questionnaires. Aim for 1 to 3 questions total: one core metric question (CSAT, NPS, or CES) plus an optional open text question for context.
A solid CSAT question looks like this: “How satisfied were you with the support you received today?” followed by a 1 to 5 rating scale. Keep the language plain and neutral. Avoid internal jargon or terminology customers do not recognize.
Surveys should be mobile-friendly and visually clean. Simple branding helps, but complexity hurts. The goal is making it effortless for customers to share their honest feedback.
3. Choose the Right Channels and Timing
Support-driven customer satisfaction surveys often work best in-product or via email immediately after an interaction. Relationship NPS can be batched monthly or quarterly to active users. Use multiple channels when appropriate: email, in-app popups, live chat follow-ups, or links embedded in ticket closure messages.
Timing matters. Survey right after a support resolution while the experience is fresh. But avoid interrupting customers during critical workflows. A survey popup in the middle of a checkout process creates friction and hurts the very satisfaction you are trying to measure.
For social media platforms and phone support, consider sending follow-up survey questions via email within an hour of the interaction ending.
4. Collect Feedback Consistently
Consistency matters more than volume. Running a small recurring survey every month provides better trend data than a massive annual survey that gets forgotten.
Segment your results by plan type, region, customer tenure, or product line. This reveals where satisfaction varies across different customer segments. You might discover that enterprise accounts score 15 points higher on NPS than small business accounts, pointing to service quality differences that need addressing.
Set targets based on your baseline. If you start with 72% CSAT, aim for 78% next quarter. Industry benchmarks suggest aiming for CSAT above 85% and NPS above 30 for B2B SaaS, but your own trend over time matters more than hitting a perfect number.
5. Analyze, Share, and Act on Insights
Group feedback into themes like bugs, usability, pricing, and support quality. Pattern recognition beats reading individual comments. When 40% of open-text responses mention slow response time, you have actionable insights for your support team.
Share summaries regularly with product, marketing, and leadership. Simple charts and dashboards work better than raw spreadsheets. Visibility creates accountability across the organization.
Most importantly, close the loop. Follow up with detractors to understand their concerns. Thank promoters and ask for referrals or testimonials. Communicate what has changed based on customer feedback. When customers feel heard, they become more engaged and more likely to provide positive feedback in the future.
Common Challenges In Balancing Satisfaction And Productivity
Support teams often face tension between meeting customer expectations and maintaining operational efficiency. Understanding these challenges helps you avoid common pitfalls that hurt both satisfaction and team performance.
Overemphasis On Speed Over Quality
Fast response time is important, but speed without substance creates problems. Research shows that 33% of customers prefer thorough resolution over a quick but incomplete answer. When teams prioritize speed metrics above all else, service agents may rush through tickets without fully understanding customer needs. This leads to repeat contacts, higher effort for customers, and ultimately lower satisfaction scores.
The solution is balancing response time targets with quality indicators like first contact resolution and CSAT. A service agent who takes 10 minutes to resolve an issue completely delivers better value than one who responds in 2 minutes but requires three follow-ups.
Lack Of Unified Performance Data
Many support teams operate with fragmented systems. Ticket data lives in one tool. Customer feedback sits in another. Usage metrics exist in a third platform. Without unified performance data, managers cannot connect customer experience metrics to operational decisions.
Studies show that 70% of companies lack integration between their customer data systems. This creates blind spots where poor customer experience goes undetected until churn spikes. Teams need a centralized view that links tickets, surveys, SLAs, and customer health indicators in one place.
Inconsistent Measurement Standards
Different teams measuring satisfaction with different scales and frequencies makes comparison impossible. If your North America region uses a 5-point CSAT scale while EMEA uses 10 points, trend analysis becomes unreliable. Inconsistent timing further complicates matters.
Establish standardized survey questions, scales, and collection points across your organization. Document your measurement standards and review them annually. Consistency enables you to analyze data across teams, time periods, and customer segments with confidence.
Limited Visibility Into Agent Workloads
When managers cannot see how work distributes across the support team, some agents become overwhelmed while others sit idle. Overloaded agents provide rushed responses that hurt overall satisfaction. Research indicates that agents handling ticket volumes 50% above average show 20% lower CSAT scores on their interactions.
Visibility tools that display real-time workloads help managers redistribute tickets before quality suffers. Monitoring agent capacity alongside satisfaction metrics reveals the connection between resourcing decisions and customer outcomes.
Resistance To Process Improvements
Some teams resist changing established workflows even when data shows problems. A negative experience that occurs repeatedly indicates a process issue, not just individual mistakes. Market research on support operations shows that organizations resistant to process improvements see 15% higher churn rates than those with continuous improvement cultures.
Building a culture that welcomes feedback and embraces change requires leadership commitment. Share satisfaction data openly with the team. Celebrate improvements when they happen. Frame process changes as opportunities to reduce churn and gain insights into what customers truly need.
Best Practices for Tracking Customer Satisfaction Over Time
Gathering data is just the first step. These habits separate teams who collect metrics from teams who use them to create an exceptional customer experience and competitive advantage.
Use a Small Set of Metrics That Fit Your Stage
Early-stage startups might focus on just CSAT, NPS, and churn rate. Adding too many metrics creates noise and overwhelms small teams. As you grow, layer in CES, customer lifetime value, and deeper ticket analytics.
Revisit your metric set at least once a year. Business goals evolve, and your measurement approach should evolve with them. A software company launching a new product line might temporarily add satisfaction tracking specifically for that offering.
Set Benchmarks and Track Trends, Not Just Snapshots
Pick baseline numbers in a specific month or quarter. Then compare each new period against that baseline rather than reacting to single data points. A one-month dip in NPS might reflect a temporary issue. A three-month decline indicates something systemic.
Plot your satisfaction metrics against product launches, pricing changes, and policy updates. This reveals cause and effect. If CSAT dropped 10 points the month after a UI redesign, you know where to investigate.
Align Teams Around Shared Targets
Support, product, and customer success teams should share satisfaction targets. When each team optimizes independently, conflicts arise. Product might ship features that increase support volume. Success might make promises support cannot fulfill.
Some companies include CSAT or NPS goals in quarterly OKRs or tie them to team performance reviews. Shared targets create collaboration instead of silos. Everyone works toward improving customer satisfaction together.
Balance Automation With a Human Touch
Automated workflows can trigger surveys, route tickets, and send reminders at scale. But human review remains essential for sensitive feedback and complex issues. When a detractor submits a scathing comment, an automated response feels dismissive.
Combine automation for efficiency with personal replies for high-value accounts and severe complaints. This balance lets you handle volume while showing customers you genuinely care about their experience.
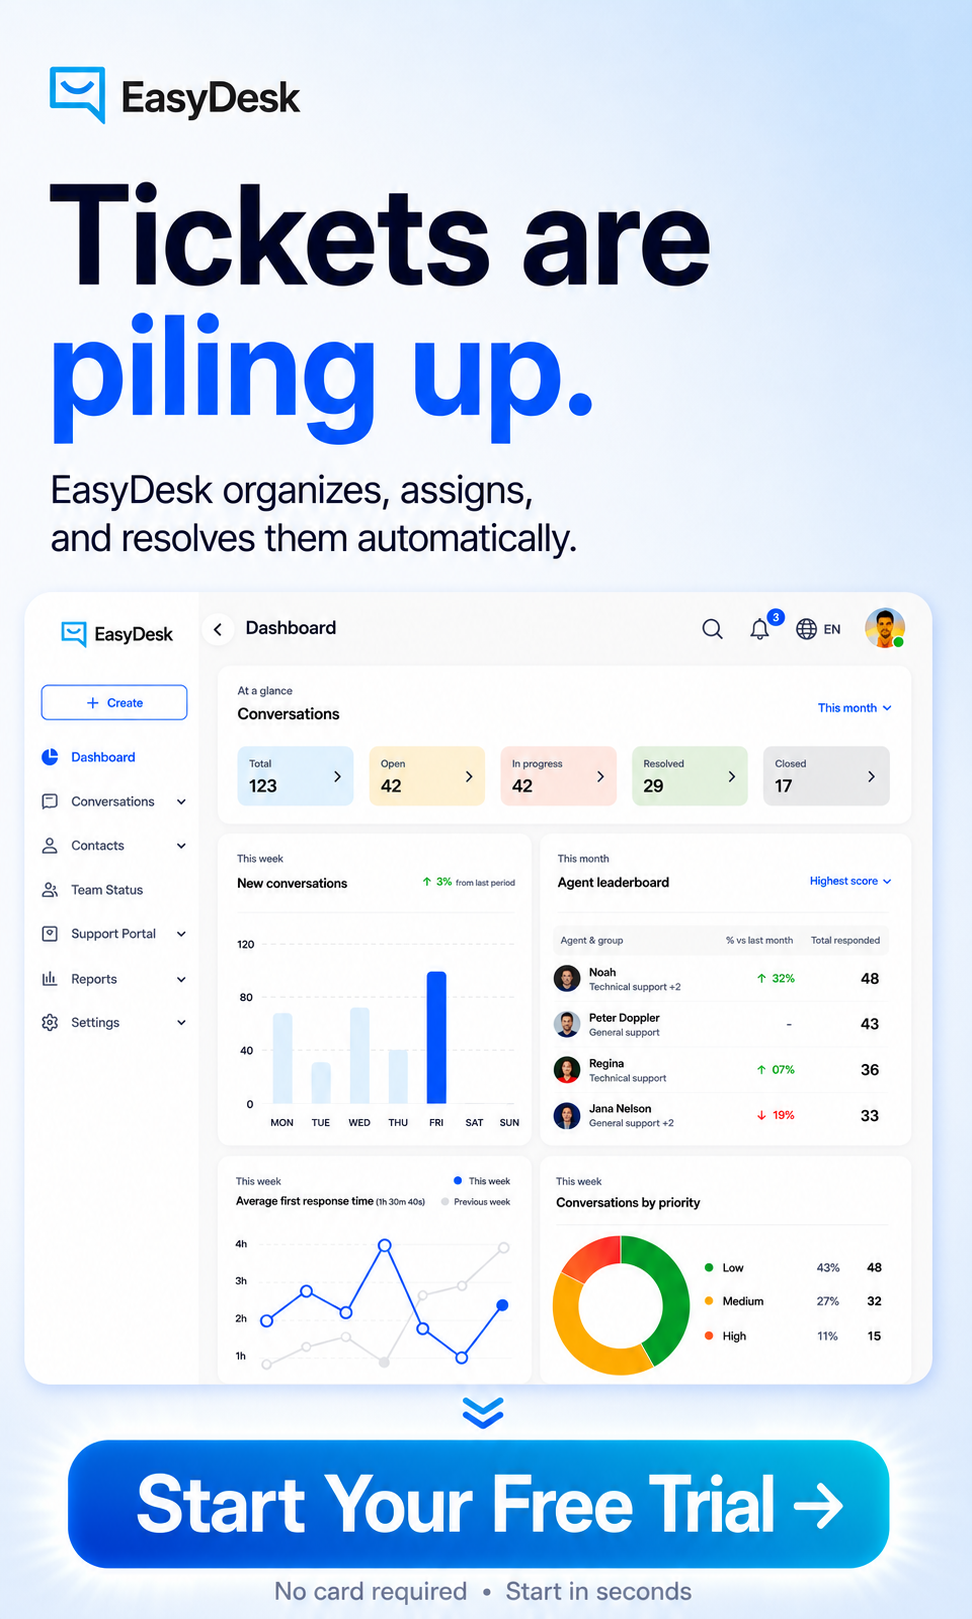
How EasyDesk Helps You Improve Customer Satisfaction Metrics
EasyDesk is a helpdesk and customer support platform built for startups and growing B2B teams who want clear, usable satisfaction metrics without enterprise complexity. It brings together the tools you need to measure customer satisfaction and act on what you learn.
EasyDesk centralizes email, chat, and social media messages into one ticketing workspace. This means CSAT and CES surveys can be collected automatically after each interaction, with responses tied directly to the tickets that generated them. No more switching between platforms to understand customer sentiment.
Teams can set SLAs inside EasyDesk, like a 2-hour first response for priority tickets, and track their impact on metrics like CSAT and response time in real time. When SLA performance changes, you see the corresponding effect on satisfaction immediately. This connection helps you understand which operational improvements matter most.
Automation rules trigger satisfaction surveys on ticket closure without manual intervention. Responses can be tagged by sentiment and low scores routed directly to managers for fast follow-up. This closed-loop system ensures no detractor feedback slips through the cracks.
The built-in knowledge base and live chat features reduce customer effort by providing clear self-service answers. When customers can solve problems without submitting tickets, CES improves and average resolution time drops. Meeting customer needs quickly builds brand reputation and drives repeat customers.
Feedback tools and a public roadmap connect what customers ask for to what your team ships. You can track how new features affect NPS and retention over the following quarters, creating accountability for delivering what your customer base wants.
Ready to see how satisfaction metrics work in practice? Start with a 14-day free trial and set up a basic CSAT and NPS workflow inside EasyDesk. Most teams see their own metrics start to take shape within the first week, giving you the foundation to improve customer retention and build loyal customers who stick around for the long term.
FAQ
How often should we measure customer satisfaction metrics?
Interaction-based metrics like CSAT and CES work best when collected continuously after tickets or chat sessions close. The experience is fresh, and response rates tend to be higher. Relationship NPS should be sent every 3 to 6 months to active customers to avoid survey fatigue while still capturing meaningful trend data.
Churn rate, retention rate, and support KPIs like response time are typically reviewed monthly by operations teams. Leadership often prefers quarterly roll-ups that combine multiple metrics into a cohesive picture of customer health and satisfaction trends.
What is a good CSAT or NPS score for a B2B SaaS company?
Many B2B SaaS teams aim for CSAT above 85% and NPS above 30. However, industry benchmarks vary widely. Telecom companies average NPS around 30, while top tech firms reach 70 or higher. What matters most is your trend over time and comparison against direct competitors in your niche.
Set your own baseline in 2026 and focus on consistent improvement quarter over quarter. A company that moves from 25 NPS to 40 over a year is making real progress, even if 40 seems modest compared to Apple.
How can small teams track satisfaction metrics without a dedicated analyst?
Start with a simple setup that requires minimal maintenance. One CSAT question after support tickets close, one NPS survey sent a few times per year, and monthly churn tracking covers the essentials. Avoid complex multi-question surveys that require extensive analysis.
Tools like EasyDesk automate collection and provide built-in reports, eliminating the need for manual spreadsheet management. Small teams can get meaningful satisfaction data flowing within days, not months.
Should customer satisfaction metrics be tied to agent performance?
Many companies use CSAT and resolution metrics as part of agent reviews, and this can drive accountability. However, context matters. A ticket about a major bug will naturally score lower than a simple password reset, regardless of agent quality. Volume and complexity should factor into evaluations.
Use satisfaction scores primarily to coach and support agents rather than as punitive targets. When agents see metrics as tools for improvement rather than punishment, they engage more constructively with feedback and focus on genuinely helping customers.
What is the biggest mistake companies make with satisfaction metrics?
The most common mistake is collecting data without acting on it. When customers provide feedback and nothing changes, they learn that their input does not matter. Response rates drop, and the customers who do respond become less candid.
Always close the loop by prioritizing issues, fixing what you can fix, and communicating improvements back to customers. A simple email saying “You mentioned slow response times, and we have now hired two additional agents” demonstrates that feedback drives real change. This builds trust and encourages customers to keep sharing their honest opinions.