Picture a Monday morning when your support inbox is buzzing with tickets, your team is stretched thin, and you have no idea whether customers are happy or quietly planning to leave. This scenario happens more often than businesses admit. In 2026, customers compare your service experience to industry leaders like Amazon and Spotify, not just your direct competitors.
Meeting customer expectations requires more than good intentions. It demands real numbers and clear trends. Feeling that customers are satisfied is not the same as knowing it through data. This guide covers the most important customer satisfaction metrics, why they matter for business growth, how to measure satisfaction properly, and how the right tools make tracking simpler.
What Are Customer Satisfaction Metrics
Customer satisfaction metrics are measurements that show how customers perceive your product, service, and support interactions. They combine perception data from customer satisfaction surveys with behavior patterns like renewals, repeat purchases, and support ticket volume. These metrics help teams understand customer sentiment at different points in the customer journey.
Think of them as your early warning system. When net promoter score drops from 42 to 25 in a single quarter, you know customer loyalty is slipping before churn hits your revenue. CSAT and CES serve as leading indicators, showing problems while there is still time to fix them. Churn rate and customer lifetime value work as lagging indicators, confirming what already happened. For support teams handling daily conversations, many of these signals come directly from customer interaction patterns and feedback collection.
Why Customer Satisfaction Metrics Crucial For Businesses
Understanding why these metrics deserve attention helps teams prioritize measurement efforts. Customer satisfaction connects directly to retention, referrals, and revenue. Research from Bain & Company shows that acquiring new customers costs five to 25 times more than keeping existing customers. When you track customer satisfaction data properly, you gain valuable insights that shape roadmap decisions, staffing plans, and pricing strategies.
Consider a B2B software team that noticed CSAT dipping below 4.0 out of 5 in late 2025. By analyzing the feedback, they discovered onboarding confusion was the root cause. After revamping their onboarding workflow, they cut related support tickets by 30 percent within two months. This kind of actionable insight only comes from consistent measurement.
Clear View Of Customer Experience Quality
Satisfaction metrics reveal exactly how happy customers are at different touchpoints. Without measurement, teams operate on assumptions. With proper tracking, you see which parts of the service experience work well and which create friction. Customer satisfaction score CSAT captures immediate reactions after support interactions. Overall satisfaction trends show whether your customer experience efforts are improving over time. This visibility helps teams understand quality perceptions and identify specific areas needing attention.
Early Detection Of Service Problems
Monitoring satisfaction levels catches issues before they become major problems. A sudden drop in customer effort score ces signals that customers are struggling with a process. Rising negative feedback on specific topics points to product issues or service quality gaps. Harvard research indicates that 89 percent of unhappy customers churn silently without complaining first. Tracking metrics gives teams the chance to address customer dissatisfaction before losing accounts.
Stronger Customer Retention And Loyalty
The link between satisfaction and retention is well documented. Companies that retain just 5 percent more customers can see profit increases between 25 and 95 percent. Loyal customers spend more, refer others, and provide valuable feedback for improvement. Customer loyalty builds over time through consistently positive experiences. By measuring customer satisfaction regularly, teams can identify at-risk accounts and take action to improve customer retention before it is too late.
Better Decision Making With Data Insights
Data removes guesswork from business decisions. Instead of debating whether a feature matters, teams can look at satisfaction data tied to that feature. Customer feedback collection provides context for numerical scores. When you gain insights from satisfaction trends, you can allocate resources more effectively. Support teams know which training their agents need. Product teams understand which features require attention. Leadership sees clear evidence supporting investment decisions.
Competitive Advantage In Customer Service
In competitive markets, service quality differentiates winners from everyone else. Businesses tracking and improving satisfaction metrics consistently outperform those that ignore them. Retention leaders grow 2.5 times faster according to Bain research. When your brand reputation reflects high satisfaction, more customers choose you over alternatives. Meeting customer expectations becomes a strength rather than a struggle.
Key Types Of Customer Satisfaction Metrics
Satisfaction metrics fall into several categories, each capturing different aspects of the customer relationship. Understanding these categories helps teams build a balanced measurement approach. No single metric type provides complete visibility. Combining multiple categories creates a more accurate picture of customer health.
Research shows that quality attributions drive 70 percent of satisfaction variance. This means understanding both emotional responses and practical experiences matters for accurate measurement. The five main categories cover score-based feedback, behavioral interactions, loyalty indicators, service performance, effort evaluation, and sentiment tracking.
Score Based Feedback Measurements
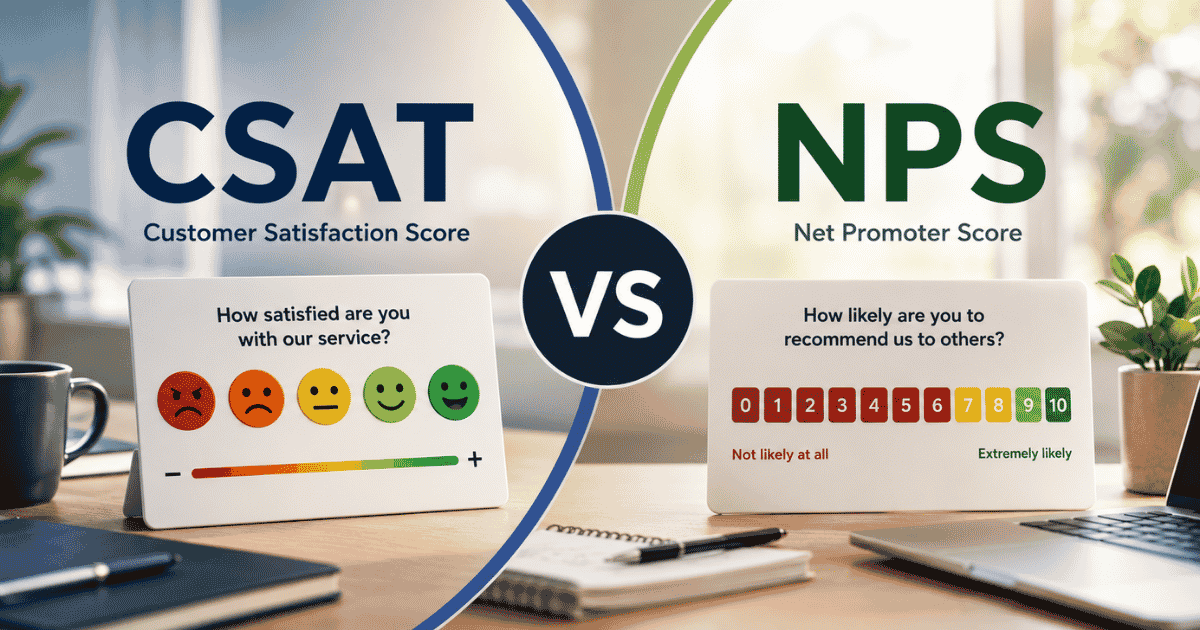
These metrics capture direct ratings from customers through surveys. Customer satisfaction score measures immediate reactions to specific interactions. You ask customers to rate their experience on a scale, typically one to five or one to ten. The calculation takes the number of customers rating four or five, divides by total responses, and multiplies by 100 for a percentage. Benchmarks across industries range from 75 to 85 percent, with scores below 70 percent signaling the need for intervention.
Net promoter score nps measures loyalty through a recommendation question. Customers rating nine or ten are promoters. Those rating zero to six are detractors. The formula subtracts detractor percentage from promoter percentage. Global averages sit around 30 for B2C and 50 for B2B companies. These score-based measurements provide quantifiable data that teams can track over time.
Behavioral Customer Interaction Metrics
Behavioral metrics track what customers do rather than what they say. Customer retention rate shows how many existing customers stay with you over time. The formula takes customers at period end, subtracts new customers added, divides by customers at period start, and multiplies by 100. High retention indicates product stickiness and satisfaction.
Customer churn rate measures the opposite. It shows the percentage of customers who leave during a period. SaaS companies aim for monthly churn below 5 percent, though averages across industries run between 5 and 7 percent. Churn costs U.S. businesses approximately 1.6 trillion dollars yearly according to Deloitte. Monitoring these behavioral patterns reveals satisfaction trends that surveys might miss.
Loyalty And Retention Indicators
Customer lifetime value measures the total revenue a customer generates over their entire relationship with your business. A simple calculation multiplies average monthly revenue per account by average customer lifespan in months. If customers pay 80 dollars monthly and stay 30 months on average, CLV equals 2,400 dollars. Higher satisfaction typically increases customer lifetime, directly boosting this metric.
Customer health score combines multiple signals like usage patterns, support interactions, spending trends, and survey responses into a single indicator. This composite score helps predict which accounts might churn and which are likely to expand. Teams can prioritize outreach to accounts showing declining health before problems escalate.
Service Performance Related Metrics
First contact resolution tracks the percentage of issues solved in a single interaction without follow-ups. Top performing teams achieve FCR rates above 70 percent. Higher FCR directly correlates with improved CSAT because customers prefer quick resolutions over extended back-and-forth.
First response time measures how quickly teams reply to initial customer contact. Research from Zendesk shows that first response under one hour boosts CSAT by 20 percent. Resolution time tracks the total duration from initial contact to problem solved. Customers expect quick and clear answers across email, chat, and social channels. These metrics help customer support team members understand their performance impact.
Customer Effort Evaluation Metrics
Customer effort score captures how much effort customers must expend to accomplish tasks like resolving issues or completing purchases. Customers rate agreement with statements like “The support team made it easy to resolve my issue” on a scale of one to five or one to seven. Lower effort correlates with higher retention. Improvements of just one point in CES can cut churn by 15 percent in banking contexts.
CES has grown in importance since the 2010s as businesses recognized that reducing friction matters as much as creating delight. Understanding how much effort customers face at different touchpoints helps teams identify specific areas for improvement.
Sentiment And Perception Tracking Metrics
Social media metrics monitor customer sentiment through engagement levels, mentions, and public comments. These provide real-time signals about brand reputation customers share publicly. Sentiment analysis tools scan text for positive, negative, or neutral language patterns.
Attribute satisfaction breaks down overall satisfaction into specific components like reliability, service quality, and how well products meet customer needs. This granular view helps teams understand which factors drive satisfaction most. Combining sentiment tracking with other metrics provides context that pure numbers cannot capture alone.
Most Common Customer Satisfaction Metrics To Track
Building an effective measurement program starts with understanding the most widely used metrics. These five represent the core measurements that SaaS and support teams rely on most. Each serves a different purpose, and together they provide comprehensive visibility into customer happiness.
The key is selecting metrics aligned with your specific goals. A company focused on reducing support friction might prioritize CES. A business emphasizing growth through referrals would focus more on NPS. Most teams benefit from tracking all five at appropriate intervals.
Customer Satisfaction Score Measurement
CSAT measures how satisfied customers are with specific interactions, products, or services. It works best for transactional feedback collected immediately after support tickets close, purchases complete, or onboarding finishes. The question typically asks customers to rate satisfaction on a scale of one to five or one to ten.
Calculation is straightforward. Take the number of responses rating four or five out of five, divide by total responses, and multiply by 100. If 660 out of 820 customers rate their experience four or five in a given month, CSAT equals 80.5 percent. This directness makes CSAT easy to understand and act upon.
Best practices include keeping surveys short, sending them immediately after interactions, and avoiding only surveying customers on positive outcomes. Teams should track CSAT by channel, agent, and issue type to identify patterns. Response rates typically drop when surveys become too frequent or lengthy.
Net Promoter Score Tracking
NPS measures customer loyalty through the question “On a scale of zero to ten, how likely are you to recommend us to a friend or colleague?” Unlike CSAT, which captures transactional satisfaction, NPS reveals broader relationship health and likelihood to refer others.
The calculation groups respondents into three categories. Promoters score nine or ten and are enthusiastic supporters. Passives score seven or eight and are satisfied but not enthusiastic. Detractors score zero to six and are unhappy customers who might damage brand reputation through negative word-of-mouth.
The formula subtracts detractor percentage from promoter percentage. If 200 promoters, 50 detractors, and 50 passives respond, NPS equals approximately 50. Scores above 50 indicate strong brand loyalty. The real value comes from follow-up questions asking why customers gave their rating. These comments reveal the drivers behind the numbers.
Customer Effort Score Analysis
CES evaluates how easy customers find it to accomplish tasks with your company. The survey asks customers to rate agreement with statements like “The company made it easy to handle my issue” on a one to five or one to seven scale. Lower effort scores predict higher retention better than satisfaction alone in many contexts.
This metric gained traction because research showed that reducing friction often matters more than creating moments of delight. Customers remember when they struggled to get help. CES trends help product and support leaders identify specific friction points in onboarding, billing, or complex workflows.
Teams should send CES surveys after support interactions and key product activities. Tracking CES by channel reveals whether certain touchpoints create more friction than others. Average CES by issue type shows which problems are hardest for customers to resolve.
First Response And Resolution Time
First response time measures the gap between when a customer reaches out and when they receive their first reply. Resolution time measures the total duration from initial contact to problem solved. Both directly impact customer satisfaction and loyalty.
Research consistently shows that faster responses correlate with higher satisfaction scores. Teams achieving average first reply times under two hours for email and under two minutes for chat typically see stronger CSAT. The key is setting expectations and meeting them consistently across channels.
First contact resolution complements these timing metrics by tracking whether issues are solved without follow-up interactions. FCR above 70 percent indicates strong support efficiency. Improving FCR requires proper agent training, access to information, and authority to solve problems without escalation.
Customer Retention And Churn Rates
Customer retention rate shows the percentage of customers who remain active over a defined period. The formula takes customers at period end, subtracts new customers acquired during that period, divides by customers at period start, and multiplies by 100. High retention signals that satisfied customers see ongoing value.
Churn rate provides the inverse view, showing what percentage of customers left during a period. If you start a month with 1,000 customers and lose 40, monthly churn equals 4 percent. SaaS benchmarks suggest keeping monthly churn below 5 percent as a target.
These metrics connect directly to satisfaction. Repeated low CSAT or rising ticket volume often signals churn risk before it materializes. Teams tracking both retention and satisfaction can identify at-risk accounts and intervene proactively to improve customer retention.
How To Measure Customer Satisfaction Effectively
Measuring customer satisfaction requires thoughtful planning beyond simply sending surveys. The process involves choosing the right collection methods, timing surveys appropriately, and combining multiple data sources for complete visibility. Effective measurement balances quantitative scores with qualitative context.
The goal is building a system that captures accurate data without overwhelming customers or creating response fatigue. Studies show that poorly designed surveys can drop response rates below 10 percent, skewing results toward the most vocal customers.
Collecting Feedback Through Surveys
Customer satisfaction surveys remain the primary method for measuring satisfaction directly. Design each survey with a clear purpose. A survey measuring onboarding satisfaction for new customers requires different questions than one evaluating support interaction quality.
Keep surveys short. One core rating question plus one or two follow-ups provides enough data without creating fatigue. Long surveys reduce completion rates and skew results. Include at least one open-ended question like “What is the one thing we should improve?” to collect feedback that explains the numbers.
Test surveys with a small group before full rollout. Check that questions are clear and scales make sense. Avoid double-barreled questions that ask about two things at once. Timing matters significantly. Send surveys immediately after interactions for CSAT and CES. Schedule NPS quarterly or biannually to all active customers.
Monitoring Customer Interactions Across Channels
Customers now communicate through email, in-app widgets, live chat, social media, and phone. Each channel provides satisfaction signals. Support teams need visibility across all channels to understand the complete customer experience.
Centralizing interactions prevents data silos between marketing, product, and support. When feedback from different channels flows into one system, teams can identify patterns that isolated views would miss. Monitor response rates by channel and adjust survey frequency accordingly.
Social media monitoring captures public sentiment that formal surveys might miss. Customers often share frustrations on Twitter or LinkedIn before contacting support directly. Tracking these mentions provides early warning of emerging issues.
Using Customer Support Analytics Tools
Analytics tools transform raw interaction data into actionable insights. Helpdesk platforms track ticket volume, response times, resolution times, and agent performance automatically. These operational metrics complement survey-based satisfaction scores.
The best tools connect operational data with satisfaction data. When teams can see that slow response times correlate with lower CSAT for specific issue types, they know where to focus improvement efforts. Dashboards that display trends over time reveal whether changes are working.
Analytics also help identify customer segments with different needs. High-value accounts might require different service levels than standard accounts. Understanding these patterns helps teams allocate resources effectively.
Tracking Behavior Based Data Insights
Behavioral data supplements survey responses with objective measures of customer actions. Product usage patterns show engagement levels. Renewal and expansion rates indicate ongoing satisfaction. Support ticket frequency reveals how often customers need help.
Combining behavioral signals creates a customer health score that predicts future outcomes. Accounts with declining usage, increased support tickets, and no recent expansion activity likely face churn risk. Teams can proactively reach out to address concerns.
Behavioral data also helps validate survey responses. Customers who rate satisfaction high but show declining usage might be at higher risk than scores suggest. The combination of stated preferences and observed behavior provides more accurate customer insights.
Combining Quantitative And Qualitative Feedback
Numbers tell what happened. Words explain why. Effective measurement programs capture both. Quantitative metrics like CSAT scores, NPS, and response times provide benchmarks and trends. Qualitative feedback from open-ended survey responses, call transcripts, and chat logs provides context.
Tag and categorize qualitative feedback by theme. Common categories include pricing, usability, speed, and feature requests. This categorization reveals patterns that inform prioritization decisions. When 40 percent of detractor comments mention a specific issue, teams know where to focus.
Review qualitative feedback regularly, not just when scores drop. Positive feedback reveals what customers value most. Neutral feedback often contains improvement suggestions. Building processes to act on feedback closes the loop and shows customers their input matters.
Challenges In Tracking Customer Satisfaction Metrics
Even well-intentioned measurement programs face obstacles. Understanding common challenges helps teams build more effective systems. These issues range from technical data problems to organizational barriers that prevent action on insights.
Addressing these challenges requires both process improvements and appropriate tools. Teams that acknowledge limitations can work around them rather than pretending perfect data exists.
Inconsistent Data Collection Methods
When different teams use different survey tools, scales, or timing, comparing results becomes impossible. One team might use a five-point scale while another uses ten points. Support might survey after every ticket while success surveys quarterly. This inconsistency fragments the overall picture.
Standardization solves this problem. Establish organization-wide definitions for key metrics. Define what counts as a satisfied response. Set consistent survey timing rules. Use the same tools across teams when possible. Document standards so new team members follow them correctly.
Low Customer Response Rates
Survey fatigue is real. Customers receive requests from many companies and ignore most. Response rates below 10 percent create unreliable data that over-represents vocal minorities. Silent customers, whether happy or unhappy, go unmeasured.
Improving response rates requires respecting customer time. Keep surveys short. Send at appropriate moments when the experience is fresh. Avoid over-surveying the same customers. Personalize requests when possible. Consider incentives for longer surveys. Monitor response rates by segment to identify groups that need different approaches.
Fragmented Customer Data Sources
Customer data often lives in multiple disconnected systems. Support tickets sit in one platform. Sales interactions in another. Product usage data in a third. This fragmentation makes building a complete customer view difficult.
Integration addresses fragmentation. Choose tools that connect with existing systems. Use customer IDs consistently across platforms. Build reporting that pulls from multiple sources. Centralized dashboards that combine data from different systems help teams see patterns that isolated views hide.
Difficulty Interpreting Feedback Results
Raw numbers without context can mislead. A CSAT of 80 percent might be excellent for one industry and concerning for another. Scores can shift due to survey wording changes rather than actual experience changes. Teams need benchmarks and trend analysis to interpret results correctly.
Build interpretation skills over time. Establish internal baselines before comparing to external benchmarks. Track trends rather than obsessing over single measurements. Combine quantitative scores with qualitative feedback to understand why numbers move. Train team members on proper interpretation to avoid overreacting to normal variance.
Lack Of Real Time Customer Insights
Traditional surveys capture snapshots at specific moments. Between surveys, teams operate without visibility into changing customer sentiment. Problems can develop and cause damage before the next measurement cycle reveals them.
Real-time monitoring complements periodic surveys. Social media monitoring catches public sentiment shifts quickly. Support ticket analysis can flag unusual patterns immediately. Behavioral data shows engagement changes as they happen. Building real-time capabilities alongside periodic measurement provides faster response to emerging issues.
Over-Reliance on Single Metrics
Focusing too heavily on one metric creates blind spots. A team obsessed with NPS might ignore operational issues that CSAT would reveal. A support team focused only on response time might sacrifice quality for speed. No single metric captures everything customers care about.
Balance comes from tracking multiple metrics together. High NPS combined with rising ticket volume suggests product usability problems despite customer loyalty. Strong CSAT with low NPS indicates transaction satisfaction without broader relationship strength. Leadership should review a combined health view rather than single global numbers.
Tools Used To Monitor Customer Satisfaction Metrics
The right tools make measurement easier and more accurate. Different tool categories serve different purposes. Most teams need a combination to cover survey collection, interaction management, analysis, and reporting.
Tool selection should match team needs and technical capabilities. Simple spreadsheets work for basic tracking. Enterprise platforms handle complex multi-channel programs. The goal is to choose tools that provide the necessary capabilities without unnecessary complexity.
Customer Feedback And Survey Platforms
Dedicated survey tools handle questionnaire design, distribution, and response collection. They offer templates for CSAT, NPS, and CES surveys with built-in calculations. Advanced features include branching logic, multi-language support, and automated distribution triggers.
Integration capabilities matter. Survey tools that connect with helpdesks and CRM systems can automatically send surveys after specific events. This automation ensures consistent timing without manual effort. Response data that flows into central systems supports combined analysis.
Helpdesk And Support Analytics Tools
Helpdesk platforms track support interactions and generate operational metrics automatically. They measure first response time, resolution time, ticket volume, and agent performance without manual tracking. Many include built-in satisfaction surveys that trigger after ticket resolution.
Support analytics reveal patterns in customer challenges. Which issue types take longest to resolve? Which agents achieve highest satisfaction scores? Which channels drive most complaints? These insights help customer success team members improve service quality.
Customer Relationship Management Systems
CRM platforms store customer information and interaction history in one place. They track relationships across sales, support, and success touchpoints. Integration with survey tools brings satisfaction data into customer profiles for complete visibility.
CRM data helps segment satisfaction analysis. Teams can compare metrics across customer segments, industries, or account sizes. This segmentation reveals whether certain groups need different approaches. Health scores built from CRM data help prioritize customer success outreach.
Sentiment Analysis And Monitoring Tools
Sentiment analysis tools use artificial intelligence to classify text feedback as positive, negative, or neutral. They process open-ended survey responses, social media mentions, and support conversations at scale. This automation helps teams analyze large volumes of qualitative feedback.
Social monitoring tools track brand mentions across platforms. They alert teams to public complaints or praise in real time. Combining sentiment analysis with other metrics provides context that pure numbers miss. Understanding customer sentiment helps teams interpret why scores change.
Reporting And Dashboard Solutions
Reporting tools combine data from multiple sources into unified dashboards. They visualize trends over time, compare metrics across segments, and highlight areas needing attention. Good dashboards make complex data accessible to non-technical users.
Automated reports delivered on regular schedules keep stakeholders informed without manual effort. Alerts can notify teams when metrics cross defined thresholds. The goal is making satisfaction data visible and actionable across the organization.
How EasyDesk Helps Improve Customer Satisfaction Metrics
EasyDesk brings essential customer support features together in one streamlined platform, making it easier to track and improve satisfaction metrics. By centralizing communication and providing built-in analytics, EasyDesk helps teams respond faster, stay organized, and understand customer happiness trends.
For support teams handling daily conversations across multiple channels, EasyDesk provides the visibility and tools needed to improve customer satisfaction systematically.
Centralized Customer Communication Tracking
EasyDesk pulls email, chat, and social conversations into a shared workspace. This centralization means no more scattered conversations or missed messages. Teams see complete customer interaction history in one place, enabling more consistent and informed responses.
Collision detection prevents duplicate replies when multiple agents work simultaneously. Internal notes let team members share context without customers seeing behind-the-scenes discussion. Assignments ensure every ticket has clear ownership. These collaboration features reduce dropped conversations and improve first contact resolution rates.
Real Time Support Performance Insights
EasyDesk analytics display response times, resolution times, and ticket volume trends alongside satisfaction scores. Teams can see how operational performance connects to customer happiness. When first response times increase, teams can investigate before satisfaction scores drop.
Performance tracking by channel shows where customers experience friction. If chat receives faster responses than email, teams can adjust staffing accordingly. Agent-level metrics help identify training needs and recognize top performers. Real-time visibility enables faster adjustments than waiting for monthly reports.
Automated Feedback Collection Tools
Built-in feedback tracking allows teams to collect customer ratings after ticket resolution. Surveys can trigger automatically when tickets close, ensuring consistent measurement without manual effort. Results appear on shared dashboards where managers can monitor trends.
Automation maintains measurement consistency while reducing team workload. When surveys happen automatically at the right moments, response rates typically improve. Teams can focus on responding to feedback rather than managing survey logistics.
Data Driven Reporting And Analytics
EasyDesk reporting combines operational metrics with satisfaction data for comprehensive views. Teams can slice data by time period, channel, agent, or issue type to identify specific improvement opportunities. Trend charts reveal whether changes are working.
SLA management features track whether teams meet response commitments. When SLA performance connects to satisfaction scores, teams understand the business impact of meeting or missing targets. Reports can be shared with leadership to demonstrate customer success team performance and support resource requests.
Frequently Asked Questions
Which Customer Satisfaction Metric Is Most Important?
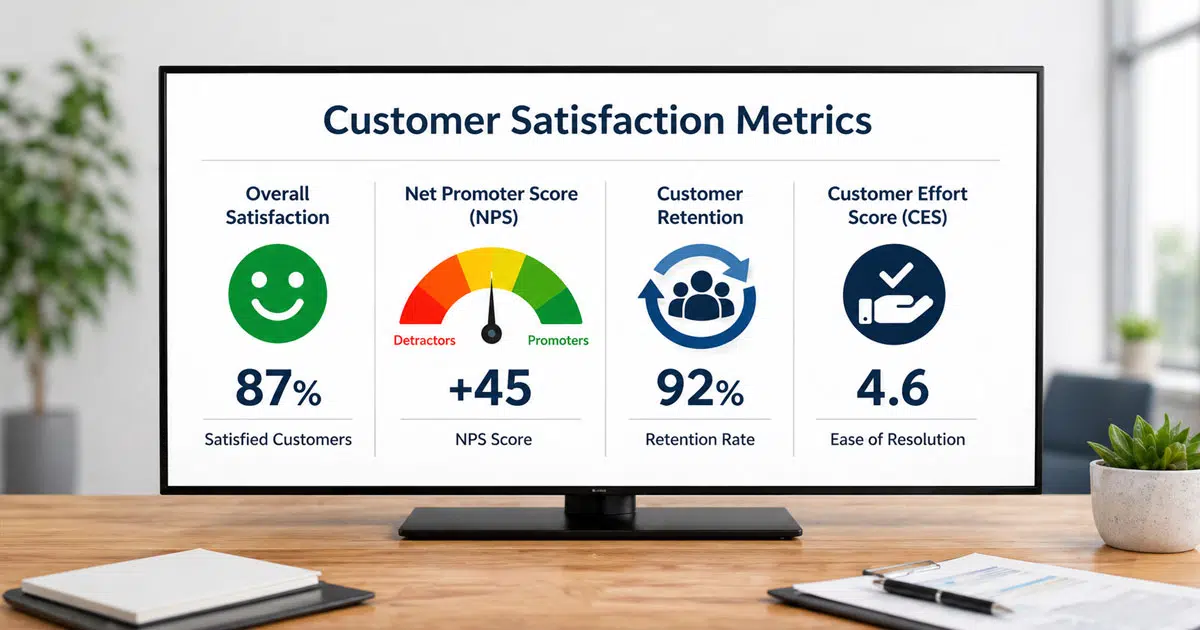
Among all key customer satisfaction metrics, the customer satisfaction score and net promoter score are widely considered the most important. These metrics help businesses understand customer service satisfaction, identify trends in customer experience, and determine how satisfied customers are with service quality and support interactions.
How Often Should Customer Satisfaction Be Measured?
Measuring customer satisfaction should happen regularly through surveys, feedback tools, and performance tracking systems. Many organizations monitor metrics to measure satisfaction monthly or quarterly, while customer support teams may track customer interaction feedback after every service experience to maintain consistent insights.
What Is A Good Customer Satisfaction Score Range?
A strong customer satisfaction score generally falls above eighty percent, though expectations vary by industry. High satisfaction levels indicate positive customer sentiment, strong customer relationships, and consistent service quality that supports business success and long term customer retention.
How Can Businesses Improve Customer Satisfaction Metrics?
Companies can improve customer satisfaction by addressing customer needs quickly, resolving customer challenges effectively, and strengthening customer service satisfaction. Investing in training, improving communication, and collecting actionable feedback helps prevent poor customer service and enhances the overall customer journey.
Why Do Customer Satisfaction Scores Decline Over Time?
Customer satisfaction scores often decline due to poor customer experience, inconsistent service delivery, or unmet customer expectations. Negative feedback, delayed responses, and unresolved issues can increase customer dissatisfaction and damage brand reputation if not addressed promptly.