Customer support metrics act as vital signs for your support operations. These key indicators reveal how effectively your customer service strategy performs by offering clear insights into agent productivity, support workflows, and interaction quality. Similar to how doctors rely on health readings, businesses rely on metrics to identify strengths and gaps in customer experience.
These metrics directly influence customer loyalty and revenue, especially since customer experience now holds equal importance to products and services for most buyers. Support metrics generally fall into three categories: customer satisfaction, operational efficiency, and business value. Together, they guide smarter decisions, align support efforts with business goals, and ensure continuous service improvement rather than guesswork.
What Are The Key Categories Of Customer Support Metrics
Customer support metrics categorization gives you a strategic edge to improve your service operations. A framework to measure what truly matters to your business emerges when you categorize metrics instead of tracking random numbers.
These categories make practical sense for your support strategy. Let me break them down.
Customer support metrics are split into two main types: quantitative and qualitative. Quantitative metrics deal with hard data and operational aspects of your service. Your team's efficiency shows through concrete numbers like response times and resolution rates. Qualitative metrics show the story behind the data and highlight customer opinions and satisfaction levels. Both types give you a detailed view of your support performance.
Metrics are also grouped by what they measure. Productivity metrics show your support team's workload through ticket volume and resolution rates. Performance metrics track issue resolution time frames, such as average resolution time. Experience metrics show how customers see their interactions with your brand.
Support leaders often group metrics into these key areas:
- Customer satisfaction and experience metrics - Including Customer Satisfaction (CSAT), Net Promoter Score (NPS), and Customer Effort Score (CES)
- Operational efficiency metrics - Covering first response time, overall resolution rate, and average handling time
- Quality and effectiveness metrics - Measuring first contact resolution rate and ticket reopens
- Retention and loyalty metrics - Tracking customer churn and retention rates
Some organizations group metrics by their business effect. Quality metrics show support interaction accuracy, while efficiency metrics evaluate resource use. Employee satisfaction metrics matter more now because they affect customer experience outcomes.
Your customer support metrics should follow SMART guidelines to work best – being Specific, Measurable, Attainable, Relevant, and Timely. This approach helps you track meaningful indicators rather than vanity metrics that look good but offer little applicable insight.
The best support teams understand how different metric categories associate with each other. Better first contact resolution (a performance metric) often results in higher customer satisfaction scores (an experience metric). Quick response times are usually linked to better customer retention.
This categorization method creates balance in your measurement approach. Teams that focus on just one type of metric often draw wrong conclusions. Your team might look efficient when you only check quantitative data, but you could miss signs that customers aren't happy.
The next sections explore specific metrics in each category. Pick metrics that match your business goals and customer needs. Success comes from choosing metrics that reflect your customers' priorities and business objectives.
Customer Satisfaction And Experience Metrics To Track
Customer experience measurement relies on three vital metrics that show how customers feel about their interactions with your support team. These satisfaction indicators help you learn about the emotional effect of your service efforts beyond simple operational data.
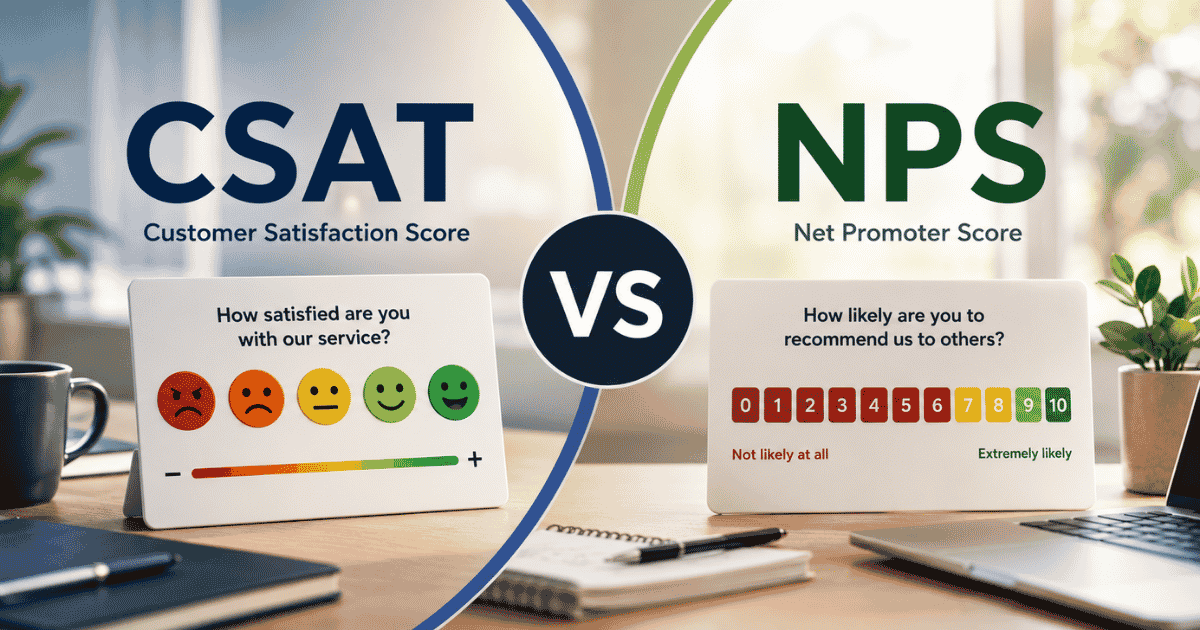
Customer Satisfaction Score (CSAT)
CSAT stands as one of the most direct ways to measure customer sentiment. This metric asks customers to rate their satisfaction with a specific product, service, or interaction on a scale of 1-5. You can calculate CSAT by dividing the number of satisfied customers (those rating 4 or 5) by the total responses, then multiplying by 100. CSAT proves valuable because you can measure satisfaction at specific touchpoints or throughout the customer's experience.
CSAT works great to identify immediate service issues. About 88% of organizations use CSAT as a key performance indicator to measure service team success. In spite of that, satisfaction alone doesn't paint the complete picture.
Net Promoter Score (NPS)
NPS fills this gap. Instead of measuring satisfaction, NPS reveals customer loyalty through one question: "How likely are you to recommend our company to a friend or colleague?" The 0-10 scale responses classify customers as promoters (9-10), passives (7-8), and detractors (0-6). Your final NPS comes from subtracting the percentage of detractors from promoters.
NPS has become a trusted predictor of business growth since 2003. Your higher NPS means customers will likely buy from you again. Research shows 88% of customers buy again after a positive experience.
Customer Effort Score (CES)
CES rounds out these metrics by measuring how easily customers resolved their issues. CES asks customers to rate statements like "The company made it easy for me to handle my issue". This metric relates directly to loyalty. Gartner's research reveals that 96% of customers become disloyal after high-effort interactions, compared to only 9% after low-effort ones.
These metrics work best together. CSAT gives quick feedback on specific interactions but might not predict future loyalty. NPS shows the bigger picture of advocacy potential, while CES reveals service friction points. Combined, they offer a complete view of your customer experience world.
Timing plays a crucial role in implementing these metrics. Send CSAT surveys right after support interactions. Measure CES after specific transactions or resolutions. For NPS, wait until customers have enough experience with your product or service, then continue quarterly or twice yearly.
Regular monitoring of these metrics helps you spot trends and make smart decisions about your customer support strategy. You can connect these satisfaction indicators with operational metrics to understand how specific aspects of your service affect overall customer happiness.
Response Time And Resolution Metrics That Define Speed
Customer service speed can make or break your business. The moment customers reach out with problems, time becomes critical, and your response speed directly affects their satisfaction. These speed metrics give a clear picture of how well your support team performs.
First Response Time (FRT)
FRT shows how long customers wait to get their first meaningful response from your support team. This metric is vital since 90% of customers consider an "immediate" response important for support. Most customers think "immediate" means within 10 minutes. Each channel sets different expectations—emails need responses within 24 hours, social media within 5 hours, and live chat within 1 minute.
The FRT calculation is simple. You divide the total first response time by the number of resolved tickets during a specific period. Let's say your total response time reaches 1,500 minutes for 500 tickets - your FRT would be 3 minutes. Most help desk softwares handle these calculations automatically.
Average Resolution Time (ART)
ART measures the time needed to solve customer issues completely, from first contact to final solution. This is different from response time because it tracks the whole support process. A Harvard Business Review study shows that faster solutions increase conversion and repeat purchase chances. About 61% of consumers think excellent customer support means quick problem resolution.
You can calculate ART by dividing the total resolution time by the number of resolved issues. Look for patterns in different types of issues and individual agent performance to find ways to improve.
Average Handle Time (AHT)
AHT tracks how long a complete customer interaction takes, including talk time, holds, and after-call work. AHT focuses on active customer engagement time. Cornell University research reveals AHT varies by industry; telecommunication companies average 8.8 minutes, while financial services take about 4.7 minutes.
First Contact Resolution (FCR)
shows the percentage of customer issues solved in the first interaction. This efficiency metric reflects how well your agents handle customer needs quickly and thoroughly. A good FCR rate falls between 70% to 75%.
Business hours play a key role in these calculations. Support platforms don't include time outside business hours when calculating response or resolution times. This means if your business runs Monday through Friday from 9-5, a ticket created Friday evening and fixed Monday morning might show a shorter resolution time than the actual waiting time.
These speed metrics work together to show your overall support efficiency. Better performance in one area usually leads to improvements in others, creating better customer experiences overall.
Ticket Volume And Support Workload Metrics
Support ticket tracking reveals significant insights about customer needs and team capacity. Your support operation depends on ticket volume and workload metrics. These metrics are the foundations of resource planning and pattern identification.
Ticket Volume
Ticket volume measures the total support tickets created in a specific timeframe (daily, weekly, or monthly). This basic metric shows demand patterns that help you plan staffing for peak periods. The metric becomes invaluable for resource decisions once you understand your team's effective handling capacity.
Ticket Distribution By Channel
Ticket distribution by channel analysis optimizes your support strategy. The volume breaks down across email, chat, phone, and social media channels. Your team's priorities guide proper staffing for each platform. The analysis might show 60% of tickets come through email, so you can assign resources based on this data.
Tickets Opened Vs. Solved
Tickets opened vs. solved serve as a telling workload indicator. These trend lines should run parallel in a well-functioning support system. A consistent lag in resolutions points to possible staffing issues or efficiency gaps. This ratio helps spot service delivery problems that need quick attention.
Backlog Metrics
Backlog metrics show your team's capacity limits. More requests than your team can handle leads to growing backlogs. Gartner research shows companies can cut staffing costs by 15% while keeping service levels when they predict support ticket volume well. Current and predicted backlog monitoring helps you learn from patterns and prepare for future needs.
Ticket Categorization
Ticket categorization turns raw volume data into practical insights. You can spot which product or service areas need the most support by grouping tickets by type, product, urgency, or customer segment. Tickets per customer calculations offer accurate insights whatever your company's growth stage.
Agent Utilization Rate
Agent utilization rate shows how well your support team uses their time. You can find this percentage by dividing support task hours by available work hours and multiplying by 100. This calculation helps balance workload across your team.
These volume metrics serve many purposes. They help calculate support operations' financial effects (B2B SaaS support tickets cost $20-$100 to resolve). The metrics also identify self-service improvements and enable proactive staffing changes. Companies that master these metrics boost efficiency and customer experience by ensuring enough resources meet demand.
Agent Productivity And Performance Metrics
Support agents represent your business's human side. Their performance plays a vital role in your customer service success. You need to track specific metrics that show both efficiency and effectiveness of your support team to evaluate agent productivity.
The way agents perform affects customer retention and operational efficiency. Good agent metrics help balance speed with quality. These metrics also point out where your team needs coaching.
Customer Satisfaction Score (CSAT)
CSAT stands as a key indicator of agent performance. Your customers' assessment of support team interactions gives a clear picture of how well agents connect with them. You can calculate this by dividing positive responses by total responses and multiplying by 100.
Internal Quality Score (IQS)
IQS shows how well your customer service interactions work through self-reviews, peer reviews, or managerial reviews. This quality check gives an inside view of agent performance that adds to customer feedback.
Agent Effort Score (AES)
AES shows how easily agents can help their customers. This metric stands out as it shows performance from the agent's view. The calculation involves adding agent survey scores and dividing by respondent count.
Productivity metrics like tickets handled per hour reveal the number of tickets an agent opens and works with hourly. Tickets solved per hour show how many issues an agent fixes in that time.
First Contact Resolution (FCR)
FCR tells you what percentage of issues get fixed in the first interaction. Top call centers aim for FCR rates near 80%. Regular training can boost FCR by up to 25%, which cuts operational costs.
Schedule Adherence
Schedule adherence measures how well agents stick to their assigned shifts. Most teams target 85-95%. This helps maintain proper staffing during busy hours and delivers consistent customer experiences.
Occupancy Rate
The occupancy rate shows the time agents spend helping customers versus other activities. The sweet spot lies between 75-85%.
Agent Utilization Rate
Agent utilization rate reveals the time agents spend supporting or staying ready to support customers. This helps you see if workflow spreads evenly across your team.
The best approach mixes numbers with quality checks. Performance dashboards and call analytics help agents see their strengths and areas needing work. This data-based coaching creates clear paths for improvement while your customers get consistently great service.
Retention, Loyalty, And Revenue Metrics From Support
Quality customer support delivers more value than just solving tickets. Your business's bottom line shows the true effect of support through retention, loyalty, and revenue metrics. These indicators show how support experiences directly affect financial outcomes.
Customer Lifetime Value (CLV)
CLV acts as the lifeblood metric that links support to long-term revenue. This calculation reveals the expected total revenue from a customer throughout your relationship. The math works simply: multiply customer value by average customer lifespan. Your CLV naturally grows when support helps customers see value.
The financial effects of better retention can be dramatic. A small 5% boost in customer retention can increase profitability by 25% or more, and might even lead to a 95% profit increase. This makes perfect sense since getting a new customer costs six to seven times more than keeping an existing one.
The Support Contribution Index offers a framework to measure support's value by linking support efforts to actual business results. This value chain has four links: support effort, support impact, customer value realization, and business value realization.
Net Revenue Retention (NRR)
NRR helps track direct revenue by showing how well you keep and grow revenue from existing customers. This metric shows how support teams prevent revenue loss while finding upsell opportunities. The Revenue Retention Rate per Agent measures how much revenue each agent managed to keep.
Upsell And Cross-sell Revenue
Upsell and Cross-sell Revenue tracks extra money earned from existing customers. Positive support interactions create natural openings for these conversations.
The Repeat Purchase Rate directly shows support success by tracking the percentage of returning customers. Customers who receive good support keep coming back. Research proves this - customers who trust a brand are 88% more likely to buy again.
Rising Churn Rate signals that support experiences fall short of customer expectations. This metric remains the clearest sign of retention problems.
You need to link these metrics to specific support activities to see the real revenue impact. Companies that use knowledge-driven support see 2-3x returns within 12 months through lower costs, better retention, and faster product adoption.
Great support interactions multiply financial benefits. Studies show positive support experiences boost customer lifetime value by 20-25%. Each support metric plays its part in the company's financial success.
How To Select The Right Customer Support Metrics
Customer support teams need different metrics based on their unique situations. Managers often make the mistake of jumping to metrics before they think about the actual problems they need to solve. You should understand your business needs first, then choose what to measure.
Your goals deserve careful attention. Start by figuring out what matters most to your boss. Look for metrics that show how your support team helps achieve the company's priorities. Next, your customer service vision should guide which metrics prove you're delivering on your promises. The best way to review individual contributions is by focusing on behaviors that lead to good results, not just the outcomes.
Each KPI must connect to a specific, measurable business outcome. Teams focused on quick responses should track time to first response. Those prioritizing quality would benefit more from customer satisfaction metrics. The Rockefeller Framework recommends one main priority per quarter backed by 3-5 supporting metrics. Adding more metrics will only scatter your team's focus and slow down progress.
These core principles will help you pick the right metrics:
- Fewer is better – Too many metrics make it hard to focus on anything specific.
- Use existing data when possible – Getting new data takes extra work, so start with what you have.
- Make metrics SMART – Specific, Measurable, Attainable, Relevant, and Time-bound.
Your team needs to believe in these metrics. The core team's involvement from day one helps build this trust. They know what customers care about and what goals are achievable.
Business environments change, so your chosen metrics need regular reviews and updates. Everyone should see the KPIs, which need frequent updates and drive action. Companies that share more data see their employees' productivity boost by 50%.
Different metrics matter to different roles. Some KPIs will matter only to specific positions, while others affect the whole company - especially those tied to broader business goals.
How To Use Customer Support Metrics For Continuous Improvement
Customer support metrics collection is just the beginning - the real value emerges when you turn this data into actual improvements. Your service needs immediate upgrades rather than waiting for quarterly reviews. A systematic approach to analyzing and acting on support metrics creates an ongoing cycle that keeps your service fresh and effective.
An evidence-based improvement strategy starts with converting metrics into specific actions. Rising response times might indicate understaffing during peak periods or knowledge gaps that slow down issue resolution. These patterns help you adjust staffing, training, or processes appropriately.
Your team can predict customer behavior and adapt through trend analysis. Regular monitoring helps spot recurring problems and developing patterns before they become serious concerns. This awareness lets you update documentation, extend self-service resources, or fix product weaknesses that generate support tickets consistently.
Performance dashboards deliver immediate insights for quick decisions, not just historical reports. The most effective method tracks momentum through automated ticket analytics, monitoring trends in first contact resolution, backlog changes, and escalation spikes.
Escalated tickets should become your priority for improvements. Cases moving from chatbots to live agents or from junior to senior team members often reveal deeper issues affecting multiple customers. Addressing these high-impact problems first maximizes your improvement efforts' return.
A comprehensive improvement approach extends beyond the support department. Marketing's discovery of customers who doubt brand promises often links to their previous support interactions. Excellence requires metrics that encourage collaboration across all departments.
Customer involvement remains crucial in the improvement process. Regular Net Promoter Score checks and transaction-based surveys help track customer needs. This direct feedback, combined with internal metrics, creates the strongest foundation for meaningful improvement.
How EasyDesk Helps You Track and Improve Support Metrics
EasyDesk has transformed how businesses approach customer support metrics through a unified and analytics-driven platform. Centralized visibility across all metrics helps teams move from reactive reporting to continuous improvement. Real-time dashboards deliver instant insights into ticket volume, resolution speed, and agent performance, eliminating delays caused by periodic reports. Teams can customize views to focus on the metrics that matter most to their goals.
The platform also excels at unifying data from email, chat, voice, and self-service channels into one clear performance view. AI-powered analytics detect recurring issues, uncover trends, and forecast future workloads, enabling smarter staffing decisions. Automated tracking of SLA metrics connects support performance directly to business outcomes, ensuring data drives measurable service improvements. Easydesk has several amazing features that you can enjoy at a suitable price.
FAQs
What are the key categories of customer support metrics?
Customer support metrics typically fall into categories such as customer satisfaction and experience, operational efficiency, quality and effectiveness, and retention and loyalty. These categories help businesses measure different aspects of their support performance, from customer happiness to team productivity.
How can businesses use customer support metrics for continuous improvement?
Businesses can use support metrics for continuous improvement by translating data into specific actions, conducting trend analysis to predict customer behavior, using real-time performance dashboards, prioritizing escalated issues, and involving customers in the improvement process through feedback.
What are some important customer satisfaction metrics to track?
Key customer satisfaction metrics include Customer Satisfaction Score (CSAT), Net Promoter Score (NPS), and Customer Effort Score (CES). These metrics help to evaluate customer sentiment, loyalty, and the ease of resolving issues.
How do response time metrics impact customer support?
Response time metrics, such as First Response Time and Average Resolution Time, significantly impact customer satisfaction. Faster response and resolution times generally lead to higher customer satisfaction and can increase the likelihood of customer retention and repeat purchases.
Why is it important to balance different types of support metrics?
Balancing different types of support metrics is crucial because it provides a comprehensive view of support performance. Focusing solely on one type of metric, such as efficiency, might lead to overlooking important aspects like customer satisfaction or quality of service. A balanced approach ensures a well-rounded evaluation of support effectiveness.