Customer service KPIs shape how a customer service team measures real impact. Poor service quality leads to low customer satisfaction and higher customer churn rate. Strong customer service kpi metrics help track customer satisfaction scores, net promoter score nps, and customer effort score ces. Each customer service representative plays a role in meeting customer expectations and improving the team’s performance.
Important customer service kpis such as first contact resolution fcr, average response time, and average resolution time show how well the customer support team handles customer queries. Clear key performance indicators improve operational efficiency and reduce total customer service costs. When service kpis align with customer needs, businesses improve customer satisfaction, strengthen customer loyalty, and increase customer retention rate across the entire customer journey.
What Are Customer Service KPIs
Customer service kpis are measurable key performance indicators that track customer service performance. They help the customer service team monitor service quality, response time, and resolution speed. Customer service managers use customer service kpi metrics such as customer satisfaction score csat, net promoter score nps, customer effort score ces, and first contact resolution fcr to measure customer satisfaction and improve customer experience. Clear service kpis guide each customer service representative and support team toward higher operational efficiency and better customer relationships.
Customer service metrics track many data points, but important customer service kpis focus on business goals. Metrics may include ticket volume or average time, while KPIs connect directly to customer retention rate, customer loyalty, and customer lifetime value. Tracking both operational and experiential customer satisfaction metrics helps teams improve customer satisfaction, reduce customer churn rate, and deliver outstanding customer service across the full customer journey.
What Are The Key Performance Indicators For Customer Service
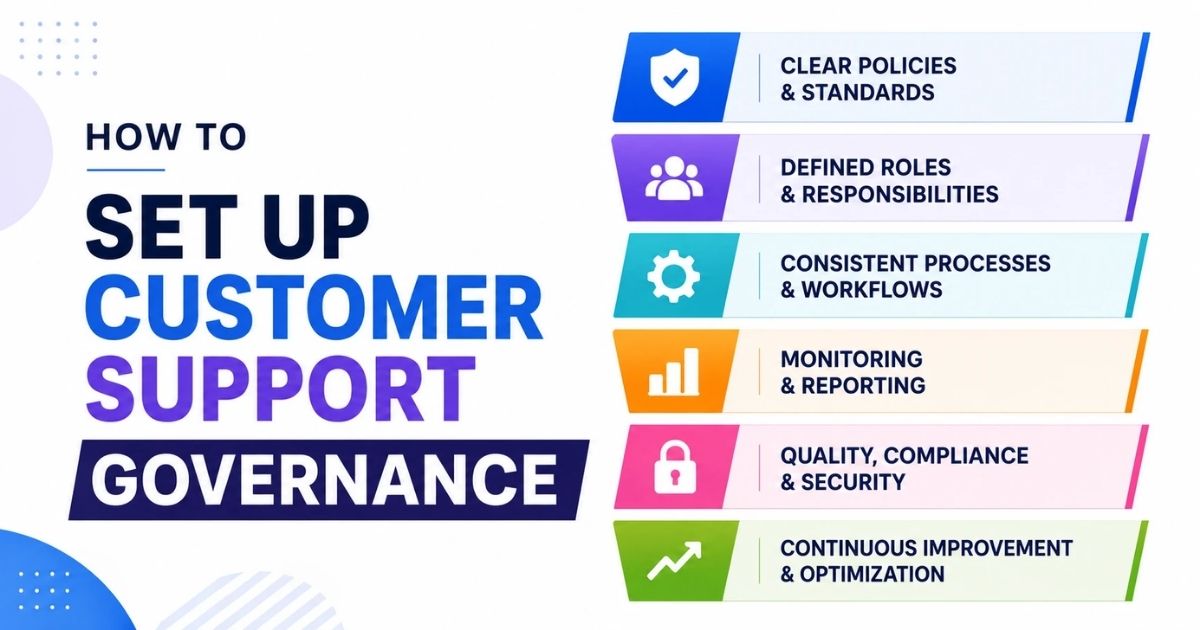
Three distinct categories are the foundations of effective customer service measurement. Each category serves a specific purpose when evaluating your support team's performance and how it affects your company's success.
Customer Satisfaction Metrics
Customer satisfaction metrics measure how happy your customers are with your products, services and support interactions. These key performance indicators for customer service provide direct insight into customer sentiment and loyalty.
Customer Satisfaction Score (CSAT): CSAT gauges how satisfied customers are with your company's goods or services at specific touchpoints. You'll measure CSAT by asking customers to rate their satisfaction on a scale from 1 to 5 after an interaction or purchase. Calculate your score by dividing the number of satisfied customers (those rating 4 or 5) by the total number of respondents and multiplying by 100. Research shows that 96% of customers say superior customer service is important when choosing and being loyal to a brand.
Net Promoter Score (NPS): NPS measures customer loyalty by asking one simple question: "How likely are you to recommend our company to a friend?" on a scale from 0 to 10. Customers who score 9 or 10 are promoters, while those scoring 0 to 6 are detractors. Scores of 7 or 8 fall into the passive category. Your NPS is the percentage of promoters minus the percentage of detractors, resulting in a score from -100 to +100. This metric taps into customer advocacy potential and serves as a strong indicator of your company's long-term success.
Customer Effort Score (CES): CES refers to the amount of effort a customer has to spend to resolve an issue. This could be how long it takes them to find the answer in your knowledge base or how much time they need communicating with your customer service team. You measure CES by asking customers to rate statements like "The company made it easy for me to handle my issue" on a 5 or 7-point scale. Lower effort scores relate to higher customer satisfaction and loyalty. 78% of customers are likely to forgive a business for a mistake if they receive exceptional customer service.
Operational Efficiency Indicators
Operational efficiency indicators measure how well your customer service team handles support processes and workflows. These customer service kpi metrics focus on quantitative data like response rates and resolution times.
First Contact Resolution (FCR): FCR represents the percentage of customer support tickets that agents resolve on first contact with the customer. You calculate FCR by dividing the number of tickets resolved during the initial interaction by the total number of submitted tickets. High FCR rates signal that customers don't need transfers to other representatives or follow-up interactions.
Average Resolution Time: It measures the amount of time it takes for a customer service representative to complete a ticket from start to finish. Calculate this by taking the time to resolve all tickets within a specific period divided by the total number of resolved tickets. Shorter resolution times reflect effective customer service, though you must account for each ticket's complexity.
Agent Occupancy Rates: This tracks how much time your customer service agents spend assisting customers. This has answering questions, handling phone calls and working through support ticket backlogs. High occupancy percentages signal that representatives spend most of their time handling customers.
Business Value Measurements
Business value measurements demonstrate how your customer service efforts affect your company's bottom line and long-term growth. These customer service kpis connect support quality to financial outcomes.
Customer Retention Rate: It indicates your knowing how to keep customers over time. Calculate retention by taking the number of customers at the end of a period, subtracting new customers acquired, dividing by customers at the start of the period and multiplying by 100. Strong retention rates affect other key customer service performance metrics like NPS and CSAT scores positively.
Customer Churn Rate: Churn rate measures the rate at which customers stop doing business with your company. Divide the total number of customers lost by the total number of customers in the same time period, then multiply by 100. This metric serves as a critical indicator of customer satisfaction and service effectiveness. Research shows that 53% of support teams have seen an increase in customer support requests since COVID-19 hit.
Cost Per Resolution: CPR calculates the expense of resolving each customer support ticket. Take the sum of your customer service department costs for a given time period and divide it by the number of resolved tickets for the same period. This metric helps you understand operational and staffing costs, enabling smarter resource allocation decisions. So, 94% of customers who think over their experience with a business as 'very good' are likely to purchase that company's additional products or services in the future.
Essential Customer Service KPI Metrics To Track
The right customer service KPI metrics separate high-performing support teams from those struggling to meet customer expectations. These six metrics provide the foundation to track service quality and operational efficiency.
First Contact Resolution Rate
First contact resolution measures your team's capacity to solve customer issues during the initial interaction without transfers or follow-ups. Calculate FCR by dividing the total number of issues resolved on first contact by the total number of interactions, then multiply by 100.
Industry benchmarks show that an FCR rate of 70-75% is good. World-class contact centers achieve 80% or higher, though only 5% reach this level. Customers who experience FCR continue doing business with your organization 95% of the time. Every 1% improvement in FCR reduces operating costs by 1% and boosts customer satisfaction by the same percentage.
Average Response Time
Average response time tracks how long customers wait between submitting an inquiry and receiving their first reply from your customer service team. Calculate this metric by dividing total response time by the number of responses.
Customer expectations vary by channel. Email support demands stellar performance under 1 hour, while average response sits at 12-24 hours. Live chat needs faster attention with stellar response times under 1 minute and average at 10 minutes. Social media requires responses under 15 minutes to deliver stellar service.
Research shows that 90% of customers rate an immediate response as important or very important, with 60% defining immediate as 10 minutes or less. Brands that resolve concerns within six hours see an estimated revenue lift of 2%.
Customer Satisfaction Score CSAT
CSAT measures how satisfied customers are with specific interactions using a simple 1-5 scale survey. Ask customers "How would you rate your satisfaction with the service you received?" right after support interactions.
Calculate CSAT by dividing the number of satisfied customers (those rating 4 or 5) by total survey responses, then multiply by 100. Industries call scores between 75-85% good, while anything above 90% indicates exemplary performance. The average CSAT across all industries stands at 78%.
Keep surveys brief to get higher response rates. Many surveys contain just one question and let customers submit responses in two clicks.
Net Promoter Score NPS
NPS gauges customer loyalty by asking "How likely are you to recommend us to a friend?" on a 0-10 scale. Customers rating 9-10 are promoters, 7-8 are passives, and 0-6 are detractors.
Subtract the percentage of detractors from the percentage of promoters to get your NPS. Scores above 0 are good, above 20 is favorable, above 50 is excellent, and above 80 represents world-class performance. Passives count toward total respondents but don't affect the score calculation.
Customer Effort Score CES
Customer Effort Score quantifies how much effort customers expend to resolve issues. Survey customers after interactions with questions like "The company made it easy for me to resolve my issue" on a 1-5 or 1-7 scale.
The correlation between effort and loyalty is striking. Research shows 96% of customers who experience high-effort service interactions become more disloyal, while only 9% of those experiencing low-effort interactions do the same. Similarly, 94% of customers with low-effort interactions intend to repurchase compared with just 4% experiencing high-effort interactions.
Average Resolution Time
Average resolution time measures how long it takes your customer service representative to resolve a ticket from creation to closure. Divide total resolution time for all tickets by the number of tickets solved in that period.
The cross-industry average sits at 24 hours. Channel expectations differ: phone calls should resolve in 3-7 minutes, live chat within 10 minutes, and email within 24 hours. Note that 61% of consumers define excellent support as one with quick resolution.
How To Measure Customer Service Performance
Measuring customer service performance requires systematic tracking and proper calculation methods. Setting up the right systems and formulas enables your customer service team to monitor progress and identify improvement opportunities.
Setting Up Tracking Systems
Determine the time frame you want to use to monitor your customer service kpis. Establish whether you want to track metrics for a specific period or maintain a rolling calculation that monitors performance over time. High-volume businesses like SaaS should measure retention monthly or even weekly. Companies with long-term contracts may only need quarterly tracking.
Define what churn means for your business. Choose which type matters most: standard churn, gross revenue churn, or adjusted churn. This definition shapes how you interpret customer service performance data.
Track performance using customer experience software to monitor customer feedback, customer churn rate, and other customer retention metrics. These tools enable your customer service department to capture data across multiple communication channels and unite insights in one place.
Review and adapt by keeping track of short-term and long-term performance to identify areas needing improvement. To cite an instance, your customer churn rate increases when your customer satisfaction score decreases. You may need to upgrade customer support processes. This correlation analysis helps pinpoint exactly where service quality breaks down.
Calculating Cost Per Resolution
Cost per resolution measures the average expense your support team incurs to resolve each customer support strategy. Calculate this by taking the sum of your total customer service costs for a given period and dividing by the number of tickets resolved during that same timeframe.
The formula accounts for all operational costs including salaries, equipment costs, and travel expenses. SaaS companies see cost per resolution between $18 and $35 per ticket. B2B support costs run higher at $30 to $60 per ticket due to greater technical complexity.
You can assess cost per resolution in four ways. High expense with high efficiency suggests your support team operates at peak performance but could trim extraneous costs. Low expense with high efficiency appears ideal but risks team burnout. High expense with low efficiency signals something is wrong. Low expense with low efficiency indicates insufficient investment in customer satisfaction.
Human agents cost around $6 per resolution with 5-10 minute handling times. AI chatbot interactions cost around $0.50 and resolve in under 30 seconds. Top-performing companies using AI report a $3.50 return for every $1 invested in support technology.
Monitoring Customer Retention Rate
Customer retention rate shows the percentage of existing customers who remain customers after a given period. This metric helps you understand what keeps customers with your company and signals opportunities to improve customer service.
Calculate retention by taking the number of customers at the end of a period and removing the number of new customers acquired during that period. Then divide that number by the customers you started with. Multiply by 100 to express it as a percentage.
Suppose you have 107 customers at the start of a one-month period. You lost 8 customers but gained 21 new ones during that month. You now have 99 of your original customers and 21 new customers, totaling 120 at period end. Input those numbers into the formula: ((120-21)/107) x 100. Your retention rate for that period was 92.5%.
SaaS businesses should aim for retention rates between 92-97%. Anything below this standard signals a need to break down why customers are leaving and address service issues at their root.
Tracking Customer Churn Rate
Customer churn rate measures the percentage of customers who stop using your product or service within a given period. Calculate churn rate by dividing the total customers churned over a specified period by the total customers at the start of the period, then multiply by 100.
You started August with 5,000 customers and lost 150. Your customer churn rate would be 3%: (150/5,000) x 100. Many businesses calculate monthly churn rates, though the time frame depends on your industry and sales cycle length.
Another calculation method tracks churn by cohort. A cohort represents customers who signed on at the same time. The formula remains similar: (total customers churned from cohort / total customers in cohort from specified time period) x 100. This approach helps you see how long people use your product before churning.
Average churn rates vary widely. Research found an average churn rate of 7.5% across SaaS customers. SaaS companies see 3-5% as solid, while less than 1% marks world-class retention success. Track your churn rate over time to establish what high churn looks like for your company.
Monitor these nine metrics alongside customer churn rate for complete visibility: Gross MRR Churn, Net MRR Churn, Net Change in Customers, Revenue Growth Rate, Activation Rate, DAU/MAU Ratio, Net Promoter Score, Customer Satisfaction Score, and Customer Lifetime Value.
Customer Support KPIs For Team Productivity
Tracking team productivity requires different customer service kpis than those measuring customer satisfaction. These internal metrics help you understand how your customer service team operates and where performance improvements can drive better outcomes.
Agent Occupancy Rates
Agent occupancy measures the percentage of time your customer service agents spend handling customer interactions compared to their total logged-in time. Calculate occupancy using this formula: (Total handling time / Total time logged in) x 100.
Support activities include answering customer support chats, handling phone calls and reducing ticket backlogs. Target occupancy ranges from 75-85%, though some organizations aim for 80-90%. Occupancy rates above 90% risk agent burnout and decreased service quality. Rates below 80% suggest overstaffing or poor time utilization.
High occupancy indicates resource utilization is good and reduces idle time. But maintaining balance proves essential. Agents who work at 100% occupancy from login to logout experience fatigue that impacts customer service quality.
Tickets Handled Per Hour
This metric shows how many support tickets an agent opens and interacts with during any given hour. Calculate it by adding the number of tickets a specified agent or team tackles in an hour.
Tickets handled per hour is different from tickets solved per hour. The former measures tickets opened and interacted with, while the latter counts only completed resolutions. Both metrics highlight your team's performance and how agents process customer queries.
Employee Satisfaction Metrics
Employee satisfaction measures how content your support team members are with their roles and your company. Methods for tracking include one-on-one conversations and employee satisfaction surveys, plus Employee Net Promoter Score (eNPS).
The eNPS asks employees to rate on a 1-10 scale how likely they are to recommend your organization as a place to work. Scores of 9-10 indicate promoters, 7-8 are passives and below 6 are detractors. Calculate eNPS by subtracting the percentage of detractors from promoters. Any score above 0 is acceptable, 10-30 is good and above 50 is excellent.
Employee satisfaction relates to customer satisfaction. Happy employees provide better customer service and this leads to improved customer experience.
Agent Touches Per Ticket
Agent touches measure how many times a customer service representative interacts with a customer before resolving their issue. Calculate this by dividing total agent replies on resolved tickets by total resolved tickets.
Research shows customer satisfaction scores and average resolution time decline when ticket touches increase. Aim for a maximum of 3 touches per ticket. To name just one example, a help desk receiving 70 tickets that require 200 agent replies would calculate: 200 / 70 = 2.9 average touches.
Higher touches may indicate agents are unprepared or need additional training. Improve this metric by streamlining support processes and providing agents with detailed knowledge bases.
How To Use Customer Service KPIs To Improve Service Quality
Customer service KPI metrics applied in ground scenarios transform raw data into practical improvements. These examples show how customer service teams can address specific performance gaps.
Analyzing First Contact Resolution FCR
First contact resolution improvement starts with identifying why issues aren't resolved during original customer interaction. Contact center managers can analyze call recordings and chat transcripts to spot patterns that cause repeat contacts. Common culprits include incomplete information, miscommunication, and inefficient processes.
AI-powered quality management tools score interactions and highlight where agents need support automatically. Supervisors learn about agent-customer exchanges without reviewing every case manually. Targeted training addresses skill gaps based on this data.
Agents equipped to handle issues on their own improve FCR rates by a lot. Agents resolve customer issues faster and decrease repeat interactions when they can remove late fees, issue refunds, and manage returns without supervisor approval. Operating costs drop by 1% while customer satisfaction rises by the same percentage for every 1% improvement in FCR.
Requester Wait Time Reduction
Long customer wait times damage satisfaction and loyalty. Research shows 52% of customers will stop purchasing from a company after experiencing long wait times. Dissatisfaction increases by 262% when customers wait longer than expected.
Smart queue management systems distribute customer flow during peak hours using virtual or mobile queuing solutions. Pre-arrival appointment scheduling allows customers to book service slots in advance. This reduces congestion and improves customer satisfaction.
Self-service kiosks reduce dependency on staff. Customers complete routine tasks on their own. Staff allocation optimized based on peak demand patterns will give the right number of customer service representatives available when needed. Clear communication through digital signage and live updates reduces perceived wait time by keeping customers informed about their queue position.
Volume By Channel Performance Improvement
Tracking orders, volume, and total revenue at each communication channel identifies underperforming partners and keeps top performers engaged. Know who your best performers are at every touchpoint. Customer service managers can pinpoint where to focus improvement efforts by measuring channel-specific metrics.
Abandon Rate Reduction
Call abandonment rates above 8% just need immediate attention. Industry benchmarks show healthy rates fall between 2-5%. Every abandoned call represents a frustrated customer who might switch to competitors.
Position-in-queue announcements and wait time estimates reduce uncertainty. Callback options allow customers to maintain their place without staying on hold. Intelligent routing directs calls to agents with the right expertise. This increases resolution likelihood on first contact. IVR menus simplified to three or four choices maximum per level prevent decision paralysis.
Best Practices Of Customer Service KPIs
Achieving important customer service KPIs just needs a strategic approach grounded in proven practices. Companies need structured methods to track and improve customer service performance.
Define Clear Goals For Your Customer Service Team
Vague aspirations won't drive customer service performance. Specify what you want to achieve. Develop it as "reduce first response time by five seconds by next quarter" instead of saying "improve first response time". The more specific your goals, the more successfully you can reach them. SMART goals (Specific, Measurable, Achievable, Relevant, Time-bound) provide direction and stability while eliminating guesswork.
Invest In Agent Training Programs
Continuous training expands your customer service agents' capabilities and makes them deliver more efficient service. Companies enjoy a remarkable $3.00 in ROI for every dollar invested in improving customer experience through trained agents. Well-trained agents resolve issues faster. This leads to better customer satisfaction and lower average resolution time. Training should cover empathy, communication, product knowledge and time management skills.
Monitor And Analyze Performance Regularly
Track and analyze your customer service KPIs continuously to ensure progress toward goals. Identify bottlenecks in your support processes and make targeted adjustments when performance falls short. Quality assurance and customer satisfaction scores show when additional training is needed. Regular reviews help fine-tune operations and improve customer support productivity.
Encourage Customer Feedback
Collect feedback through surveys, reviews and multiple communication channels. This information helps optimize operations and improve service quality. You can't identify strengths or address weaknesses without knowing what customers think. Act on customer feedback analysis quickly and communicate changes to customers. Close the loop by letting them know their input led to improvements.
Use AI And Automation Tools
AI-powered customer service tools automate routine tasks, make work efficient and assist agents. Chatbots deliver 24/7 support while reducing operational costs. AI handles tedious work and frees your customer service team to focus on complex customer issues requiring human empathy. Organizations implementing AI see improved customer satisfaction scores and better agent retention.
Tools And Strategies To Enhance Customer Service Operations
Modern customer service operations just need strong technology to meet customer expectations and improve how they operate. The right tools affect your customer service team's knowing how to track customer service KPIs and deliver outstanding customer service.
Customer Service Software Solutions
Customer service software provides a central platform to manage customer questions, track customer interaction and deliver support through communication channels of all types. Key features include ticket management to create and assign customer support ticket cases, omnichannel support for uninterrupted customer experience across email and phone calls, and support automation capabilities using AI-powered tools for case routing and sentiment analysis.
Knowledge base repositories maintain FAQs and troubleshooting guides that improve first contact resolution. Reporting and analytics generate insights into customer service performance, customer satisfaction scores and areas that need improvement.
Live Analytics And Reporting
Live analytics collect and process data from customer interaction as they occur. These systems provide dashboards showing agent performance, call queues and average response time. AI-powered sentiment analysis detects customer concerns during conversations and allows supervisors to intervene when customer satisfaction levels drop. Automated alerts notify managers when thresholds are breached, such as extended requester wait time or negative customer behavior patterns.
Knowledge Base Development
Knowledge bases enable satisfied customers to resolve problems on their own. Research shows 69% of buyers want to resolve problems independently. Effective self-service has AI-powered search functionality and regular content updates reflecting product changes. Analytics track what customers search for and identify gaps in your customer service strategy.
Multiple Communication Channels
Multichannel support lets customers reach your customer service department via preferred platforms. Centralized systems unify conversations across channels and provide complete visibility into the customer experience. Intelligent routing directs customer queries based on priority and agent skills, reducing average time to resolution while improving customer loyalty.
How Easydesk Helps Track Customer Service KPIs Effectively
EasyDesk helps the customer service team track and improve key performance indicators with tools built for clarity and speed. A centralized ticket creation and management dashboard collects all customer inquiries from email, live chat, and other channels into one space. Support teams can prioritize tickets, assign tasks, and monitor progress in real time. These features help reduce average response time and average resolution time, making it easier to measure service quality and improve customer satisfaction.
Automation and SLA management in EasyDesk also support customer service performance goals. Automated ticket routing and predefined workflows ensure the right customer issues go to the right agents fast. Feedback management lets teams capture customer concerns and improve service delivery based on customer satisfaction and service kpi data. With clear visibility into these customer service metrics, support teams can boost operational efficiency, improve customer loyalty, and strengthen overall customer experience. You can enjoy EasyDesk at a suitable price.
FAQs
How Often Should Customer Service KPIs Be Reviewed?
Customer service kpis should be reviewed weekly or monthly based on ticket volume and customer support activity. Regular reviews help customer service managers track customer service performance and adjust strategy before issues affect customer satisfaction or customer retention rate.
Can Customer Service KPIs Predict Customer Churn Rate?
Yes, customer service kpi metrics like low customer satisfaction scores, high average response time, and poor contact resolution rate often signal rising customer churn rate. Tracking key metrics early helps the customer service team protect customer loyalty and customer lifetime value.
Do Small Businesses Need Customer Support KPIs?
Yes, small businesses benefit from tracking customer support kpis to control support costs and improve service quality. Clear key performance indicators help maintain operational efficiency and deliver outstanding customer service even with limited resources.
Is Automation Helpful For Improving Service KPIs?
Yes, automation improves response time, reduces average resolution time, and strengthens contact resolution. AI tools also support customer service agents by handling routine customer inquiries and improving overall customer experience.
How Do Customer Service KPIs Impact Customer Lifetime Value?
Customer service plays a direct role in customer lifetime value. Higher customer satisfaction, strong net promoter score nps, and consistent service quality increase customer retention rate and long-term revenue growth.
Should Customer Service Managers Track Employee Satisfaction Too?
Yes, employee satisfaction affects customer service quality and the team’s performance. Motivated customer service representatives handle customer issues better, which leads to higher customer satisfaction levels and a positive customer experience.
What Role Does Customer Feedback Play In KPI Improvement?
Customer feedback helps measure customer satisfaction and understand customer behavior across the customer journey. It guides the customer service department in refining customer service strategy and improving important customer service kpis.