Your CSAT score directly impacts revenue and growth. Research shows 48% of customers switch brands after poor service experiences. Many organizations now rely on the customer satisfaction score (CSAT) as a key performance indicator. A structured customer satisfaction survey helps measure CSAT, capture customer feedback, and track customer sentiment across every customer interaction. When customers feel heard, satisfied customers stay longer, improve customer retention rate, and increase customer lifetime value.
This guide explains customer satisfaction CSAT in simple terms. You will learn how to calculate CSAT score using a clear CSAT score calculation formula and rating scale. We cover what defines a good CSAT score based on industry benchmarks, customer expectations, and customer satisfaction levels. You will also see how CSAT metrics compare with net promoter score and customer effort score. Clear customer insights help service teams reduce customer churn and improve customer loyalty.
What Is CSAT (Customer Satisfaction Score)
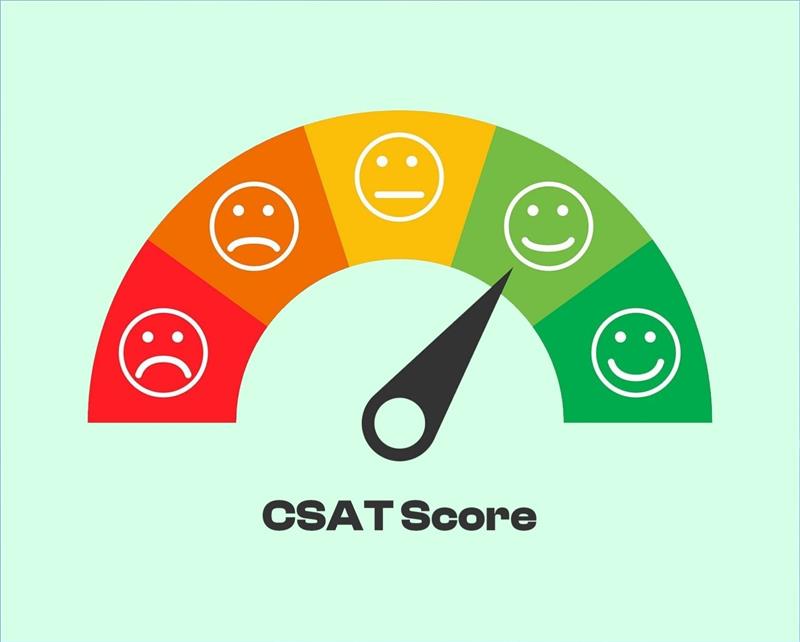
CSAT score stands for customer satisfaction score. It is a simple way of measuring customer satisfaction after a specific interaction. A CSAT survey usually asks customers how satisfied customers feel about a product or service. Most surveys use a rating scale, such as 1 to 5. Positive responses show happy customers. Negative feedback highlights unhappy customers and gaps in the customer experience.
CSAT measures customer satisfaction at key moments in the customer journey. Teams often survey customers after a customer support call or purchase. The total number of responses helps measure CSAT accurately. CSAT metrics give quick customer insights about customer sentiment and satisfaction level. A good CSAT score depends on industry benchmarks and customer expectations. Strong scores support customer loyalty, brand loyalty, and long-term customer success.
How To Calculate CSAT Score For Your Team
CSAT score gives your customer support team a clear view of customer satisfaction after each specific interaction. It is simple, practical, and easy to track. Clear CSAT metrics help you measure CSAT accurately, compare industry benchmarks, and improve customer loyalty over time.
The CSAT Score Calculation Formula
CSAT score calculation starts with a customer satisfaction survey. You ask customers to rate their satisfaction level on a rating scale, often 1 to 5. The customer satisfaction score CSAT formula is simple. CSAT (%) = (Number of Positive Responses ÷ Total Number Of Responses) × 100.
Positive responses usually mean ratings of 4 or 5. Suppose your customer support team collects 200 customer responses after a customer support call. If 170 customers feel satisfied, divide 170 by 200 and multiply by 100. Your CSAT score becomes 85%. Many industries consider 75% to 85% a good CSAT score, depending on customer expectations and product or service type.
Satisfied Customers In Your Data
Satisfied customers are those who select the top two ratings in your CSAT survey responses. On a 5 point scale, ratings of 4 and 5 count as positive responses. Ratings below that reflect neutral or negative feedback and do not support your customer satisfaction score CSAT.
Clear definitions protect your customer insights. A SaaS company may track quarterly CSAT metrics. Quarter one shows 160 satisfied customers out of 200 total number of responses. That equals 80%. Quarter three reaches 90%. That trend signals stronger customer experience, higher customer happiness, and better customer retention rate across the customer lifecycle.
Total Responses And Sample Size
Total number of responses determines whether your CSAT score reflects your real customer base. Survey research shows that 384 responses give 95% confidence with a ±5% margin of error for large populations. That benchmark appears across academic and market research studies.
Response rate also matters. If you invite 1,000 customers to survey customers and receive 300 survey responses, your response rate is 30%. Email surveys often average 30% to 50% for existing customers, while cold outreach stays under 15%. Strong sample size and solid response rates help measure customer satisfaction accurately and reduce customer churn through better customer feedback analysis, especially when you centralize replies in an email ticketing system with best practices.
When To Measure Customer Satisfaction With CSAT
Timing your customer satisfaction survey correctly determines whether you capture accurate customer feedback or miss the mark entirely. Send surveys too early and customers haven't formed opinions yet. Wait too long and the experience fades from memory. Both response rates and data accuracy drop. Research shows feedback collected at the point of experience is 40% more accurate than feedback collected even a day later.
After Customer Support Call Interactions
Contact centers should deploy CSAT surveys immediately after customer support call interactions end. You can deliver these surveys through multiple channels: by phone, email or SMS to get faster responses, especially when they’re connected to the best ticketing software for customer support. Strike while the iron is hot. Send the survey within seconds to a few hours of closing the ticket.
Two timing approaches work for support interactions. You can send the survey as soon as the call ends and capture immediate reactions. Or you can wait until the customer's issue is fully resolved, then send the CSAT survey. This second approach lets customers rate their satisfaction with how their question was handled from first to last contact.
Automation should trigger the survey within seconds of closing the ticket for live chat support. Email and phone support teams should send surveys within a few hours, ideally using ticket automation to streamline support workflows. To name just one example, a customer submits a support ticket at 2 PM. Your team resolves it by 3 PM, and the CSAT survey follows at 3:01 PM. This speed captures real feedback while the positive experience remains top of mind.
During Key Customer Lifecycle Moments
Customer lifecycle moments present valuable opportunities to measure customer satisfaction. After milestones like purchases, onboarding or completing training sessions, CSAT surveys confirm whether customers feel positively about their experience.
Gage satisfaction early enough to address issues prior to subscription renewals. Surveying six months before renewal helps you spot customers unlikely to renew. Streamlining support with ticket automation ensures follow-up actions are timely and consistent. Your sales team can then step in ahead of time to secure that customer, maybe even with a new renewal deal.
Periods of customer inactivity also warrant attention. Sending a CSAT survey helps uncover potential dissatisfaction or roadblocks to re-engagement if engagement has declined or stopped.
Post-Purchase And Product Usage Touchpoints
Post-purchase timing depends on what you want to measure. Send surveys immediately after checkout to gather feedback on the browsing and purchase experience. Wait 2-3 days post-delivery to assess shipping speed, packaging and delivery experience. After product use begins, typically 1-2 weeks, you can understand satisfaction with product quality and usability.
In-app CSAT surveys work well while customers actively use your product for ongoing product engagement. Customers are currently engaged, which increases their likelihood of sharing feedback.
Avoiding Survey Fatigue With Strategic Timing
Survey fatigue sets in when you bombard customers with too many requests. You can request feedback with every transaction for transactional surveys after purchases, but keep it to a maximum of 4 questions.
Frequency guidelines vary by audience. B2B customers typically interact less frequently, so quarterly surveys work best. Base frequency on customer interaction patterns multiplied by 2 for B2C audiences. If customers interact monthly, survey every two months.
Space surveys by at least two weeks. Better yet, wait 30 days between feedback requests. Your most loyal customers should receive no more than two surveys per month. Limit surveys to once per week per account to avoid irritation.
Personalization combats survey fatigue effectively. Sending the right surveys to the right people at the right time targets those most likely to respond. This approach prevents you from sending surveys to people who won't respond and could develop fatigue if you keep asking.
What Is A Good CSAT Score And Industry Benchmarks
A good CSAT score depends on your industry, customer expectations, and customer experience quality. Most teams track customer satisfaction score CSAT against industry benchmarks to measure customer satisfaction levels, improve customer loyalty, and reduce customer churn across the customer lifecycle.
Average CSAT Scores By Industry
Scores above 70% indicate acceptable customer satisfaction. The average CSAT score stands at 78%, but this varies substantially based on your sector and customer base. A score between 90 and 100 represents excellent performance. Scores from 70 to 89 qualify as good. Scores ranging from 50 to 69 fall into average territory, and anything below 50 signals poor customer satisfaction.
Industry measures reveal substantial differences in customer expectations. Banking maintains a CSAT score of 80%. Credit unions achieve 79%. Healthcare shows a split: non-hospital care reaches 83%, whereas hospitals average 75%. Online retail performs at 80%, above general retail at 77%. Government services lag behind at 69.7%.
The service sector shows varied results. Hotels and hospitality lead at 82%, followed by banking and financial services at 79%. Grocery retail hits 78%. The insurance industry faces challenges with a measure of 70%. Technology companies average around 78%. Full-service restaurants achieve 80% and outperform fast food establishments at 77%.
American Customer Satisfaction Index Standards
The American Customer Satisfaction Index serves as the only national cross-industry measure of customer satisfaction that represents the U.S. economy. ACSI tracks data from more than 400 companies in over 40 industries. This makes it a strategic resource to measure your customer satisfaction metrics against competitors.
ACSI functions as a proven predictor of financial performance. Companies with high ACSI scores perform well in the stock market. The index operates as a cause-and-effect model and examines customer expectations, quality ratings and perceived value. Scores range from 0 to 100 using a proprietary weighted average formula.
The federal government recognizes ACSI as the gold standard to measure customer satisfaction. So organizations use these standards to allocate resources and strengthen customer relationships.
Setting Realistic Goals For Your Support Team
Scores between 75% and 85% represent a good CSAT score for most organizations. If you achieve 80%, four out of every five customers gave positive responses. To name just one example, Klaus' Customer Service Quality Benchmark Report sets the 2023 customer satisfaction measure at 85%.
Context matters when you establish goals. An 80% CSAT score might signal industry leadership in one sector but underperformance in another. Industries with higher emotional stakes like healthcare and finance sustain higher CSAT measures. High-friction services such as internet providers face lower ceilings.
Start by comparing your scores with businesses in your industry rather than aiming for random high numbers. Your company size and customer touchpoints also influence realistic targets. SaaS companies performing at 80% show above-average performance. Healthcare or hospitality sectors might view 80% as closer to average.
How To Improve Customer Satisfaction Scores
Improving your csat score requires strategic action across multiple areas of your customer support operation. Frameworks for customer support metrics, KPIs, and best practices help you analyze what your customer feedback reveals about your service gaps.
Analyze Customer Feedback For Insights
Customer feedback analysis transforms raw survey responses into useful improvements. AI-powered tools can perform sentiment analysis instantly and classify feedback as positive, negative, or neutral. These systems identify recurring themes by grouping similar comments together, even when customers use different phrasing.
You should categorize feedback based on primary aspects like products, customer service, user experience and pricing. Create subcategories for granular organization within each category. Tags add context or cross-reference feedback spanning multiple categories. Note that 80% of customers say the experience a company provides is just as important as its products and services.
Train Your Customer Support Team
Companies that provide ongoing training for customer service teams see an average 11% reduction in first response time and report higher agent confidence. Training should never be a one-time event during onboarding. Ongoing education, combined with automation to reduce customer support response time, helps agents stay current with customer expectations and support best practices.
Well-trained employees resolve questions efficiently and represent your brand with professionalism. Studies show that ongoing training increases employee satisfaction with their jobs, which relates to happier customers.
Reduce Customer Churn Through Quick Response
Response speed affects your csat metrics. Our customer service study found that 62% of businesses didn't respond to customer emails at all. Those that did averaged over 12 hours, while nearly half of customers expect a response in under 4 hours.
Fast responses make customers feel valued. The CMO Council reports that the number one most important attribute of good customer experience is fast response time. Companies using dedicated customer support software to improve response time resolve tickets up to 35% faster and report higher customer satisfaction scores.
Turn Unhappy Customers Into Happy Customers
The smartest approach when dealing with unhappy customers is letting them voice their opinion and acknowledge their feedback. Studies show that customers with major dissatisfaction who complain and get their issue resolved often become far more loyal than customers who never had problems.
Act quickly to show your business cares and prevent incidents from spiraling. You should listen without interrupting or jumping to conclusions. Case studies where teams used EasyDesk to improve response time for a growing team show that solutions within company policy work better than fixating on what cannot be done.
Use Customer Insights To Bring About Changes
Businesses that make changes based on customer input show they care. Customers take notice when you respond to feedback by improving products or refining support. Adopting a modern customer service management system overview helps structure this responsiveness, which makes all the difference in reducing customer churn and turning customers into long-term supporters.
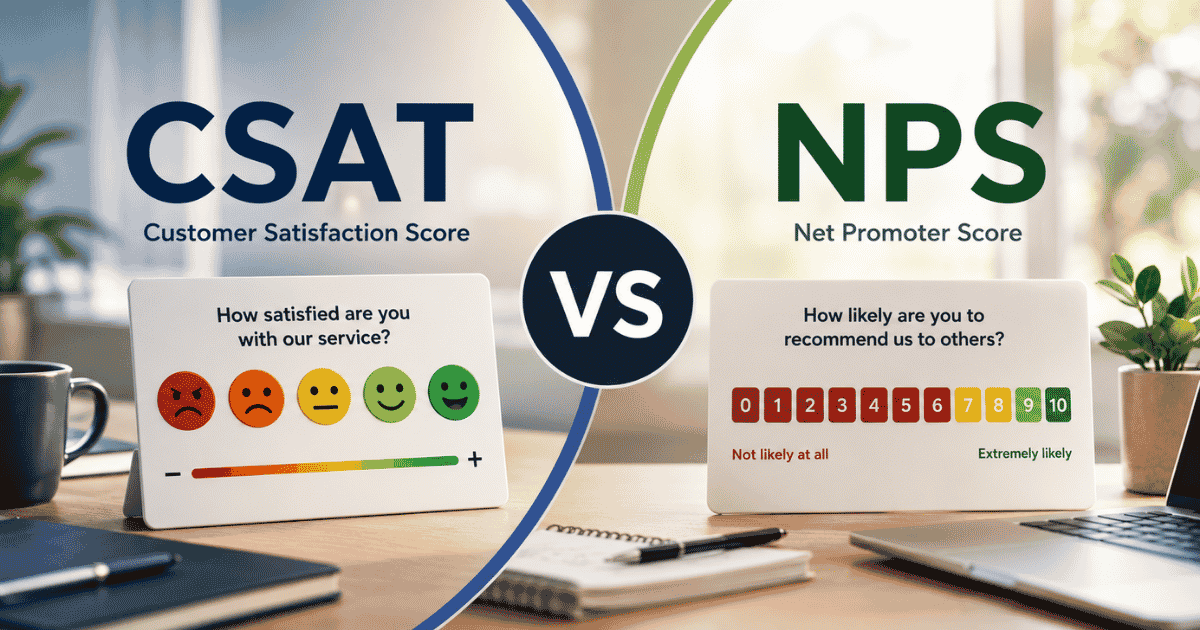
How To Use CSAT Metrics With NPS And Customer Effort Score
CSAT metrics show short-term customer satisfaction after a specific interaction. Net promoter score measures customer loyalty over time. Customer effort score tracks ease. When you combine CSAT, NPS and CES, you get stronger customer insights across the full customer journey.
Role Of CSAT In Immediate Feedback
CSAT score captures customer sentiment right after a customer support call or purchase. A CSAT survey asks how satisfied customers feel about a product or service. It reflects short term customer satisfaction levels.
The American Customer Satisfaction Index reports national averages often range between 75 and 80 out of 100 across industries. A good CSAT score usually falls between 75% and 85%, depending on industry benchmarks. CSAT measures customer satisfaction at key moments that shape customer happiness and repeat business.
NPS For Long Term Loyalty
Net promoter score focuses on advocacy. NPS measures customer loyalty by asking how likely customers are to recommend your brand. Scores range from -100 to +100. A positive score above 0 is decent. Many SaaS companies aim for +30 to +50.
NPS and CES do not replace CSAT metrics. They complement them. Strong NPS often links to higher customer lifetime value and stronger brand loyalty, especially when delivered through multi-channel customer support. When customers feel confident in your company’s products, they promote you to the same customer network.
Customer Effort Score And Ease
Customer effort score measures how easy it is for customers to resolve an issue. Research from Gartner shows 96% of customers with high effort experiences report lower customer loyalty. Ease directly impacts customer retention rate.
CES focuses on friction in the sales process or support process. Clear ticket prioritization in customer support reduces this friction. A low effort score supports improving customer satisfaction. When customers expect quick solutions and smooth service, effort becomes a critical key performance indicator.
Map Metrics To Customer Journey
Each metric fits different customer lifecycle moments. Use CSAT score after a specific interaction such as onboarding or a support ticket. Back these touchpoints with clear ticket SLA management for faster support response. Use NPS at broader stages of the customer lifecycle. Use CES after service recovery or technical support.
This layered approach tracks customer satisfaction levels across the customer journey. It shows how happy customers feel at each stage. It also highlights where unhappy customers drop off and cause customer churn.
Combine Quantitative And Qualitative Feedback
Numbers alone do not tell the full story. CSAT survey responses show the satisfaction level. Open text responses reveal valuable feedback and qualitative feedback. That insight explains why customers feel satisfied or frustrated.
A strong customer experience program reviews positive responses and negative feedback together. Teams can analyze total number of responses, themes, and customer insights. This method helps drive customer satisfaction and improve customer loyalty over time.
Set Clear Benchmarks And Targets
Industry benchmarks provide context. For example, software and app services often report CSAT scores above 80%. Full-service restaurants may see different averages due to in-person service factors. Always compare your customer satisfaction score CSAT against similar sectors.
Set targets based on data, not guesswork. Use automated ticket management software to reduce response time so operational performance keeps pace with your goals. Align CSAT, NPS and CES goals with customer success outcomes. When metrics improve together, you increase customer engagement, reduce customer churn, and grow customer lifetime value across your customer base.
How EasyDesk Supports CSAT, NPS And CES Tracking
EasyDesk makes it simple to measure CSAT score after every customer interaction. You can send a CSAT survey automatically after a customer support call or ticket closure. With EasyDesk features for smarter, secure customer support, the platform collects customer responses in one dashboard. Your customer support team can measure CSAT, review csat feedback, and track customer satisfaction levels in real time. Clear CSAT metrics help you understand how satisfied customers feel about your product or service.
EasyDesk’s secure, transparent customer support platform also supports net promoter score and customer effort score tracking. As a ticketing software built for better customer support, you can survey customers at different customer lifecycle moments and compare NPS and CES with your customer satisfaction score, CSAT. This unified customer experience program gives strong customer insights. It helps reduce customer churn, improve customer loyalty, and increase customer lifetime value across your customer base.
FAQs
Does CSAT Score Affect Customer Lifetime Value And Revenue Growth?
Yes. A strong CSAT score links directly to higher customer lifetime value and repeat business. Satisfied customers stay longer, reduce customer churn, and strengthen customer loyalty. Higher customer satisfaction levels often translate into better retention and steady revenue growth.
Can Small Teams Measure CSAT Without Advanced Tools?
Yes. A simple customer satisfaction survey with a basic rating scale can measure CSAT effectively. Track total number of responses and calculate the customer satisfaction score CSAT using the standard formula. Even small service teams can gather valuable customer feedback and customer insights, especially when they adopt the benefits of using a ticketing system to organize requests.
Is CSAT Better Than Net Promoter Score For Tracking Customer Sentiment?
No. CSAT measures customer satisfaction after a specific interaction, while net promoter score measures customer loyalty over time. NPS and CES complement CSAT metrics. Together, they give a broader view of customer sentiment and overall customer experience, especially when used within a modern customer service management system.
Should You Send A CSAT Survey After Every Customer Interaction?
No. Sending a CSAT survey after every customer interaction can cause survey fatigue. Complement surveys with self-service customer support best practices so customers can get help without constant survey prompts. Focus on key customer lifecycle moments such as post-purchase or after a customer support call. Strategic timing improves survey response rates and customer engagement.
How Does Customer Effort Score Impact Customer Satisfaction Levels?
Customer effort score measures how easy it is for customers to resolve issues. Implementing a live chat ticketing system can lower effort dramatically. Lower effort improves customer satisfaction and customer happiness. When customers expect quick solutions and smooth service, ease becomes critical for improving customer loyalty and reducing customer churn.