Every support ticket tells a story. Every chat transcript reveals what customers need. Every phone call holds clues about why people stay or leave. But without a way to organize and understand this information, those stories remain scattered and hard to act on.
Customer support analytics changes that. It gives support teams the ability to see patterns in customer interactions, measure what matters, and make decisions based on real data rather than hunches. Whether you handle a few hundred tickets a month or thousands, analytics helps you understand your customer data in ways that improve service quality and keep existing customers coming back.
This guide walks through what customer support analytics means in practice, which key metrics to track, and how to use actionable insights to build a support operation that scales. You will find concrete examples, practical use cases, and steps you can take in the next 30 to 90 days to improve customer service performance.
What Is Customer Support Analytics
Customer support analytics is the practice of turning every kind of support interaction into insights that help teams respond faster, solve problems efficiently, and retain more customers. This includes email tickets, live chat transcripts, phone call logs, social media messages, in-app messaging, and customer surveys. When you analyze this support data systematically, patterns emerge that would otherwise stay hidden.
The data sources feeding customer support analytics have expanded significantly over the years. Teams now pull from email ticket history, live chat transcripts, phone call recordings from 2020 through 2025, in-app messages, satisfaction surveys, and help center search terms. Each source adds another layer of understanding about customer behavior and customer preferences.
Consider the difference between gut feeling and data-backed decisions. A support manager might believe many customers struggle with onboarding because agents mention it in team meetings. But tracking reveals the actual scale: perhaps 40% of users who canceled in Q4 2024 had opened support tickets about onboarding confusion. That specific number changes how engineering and product teams prioritize their work. It turns an impression into a business case.
Why Is Customer Support Analytics Important In 2026
Customer expectations continue to rise as digital support channels expand and service interactions increase. Organizations rely on customer support analytics to understand performance trends, improve service delivery, and build stronger relationships with customers across every support touchpoint.
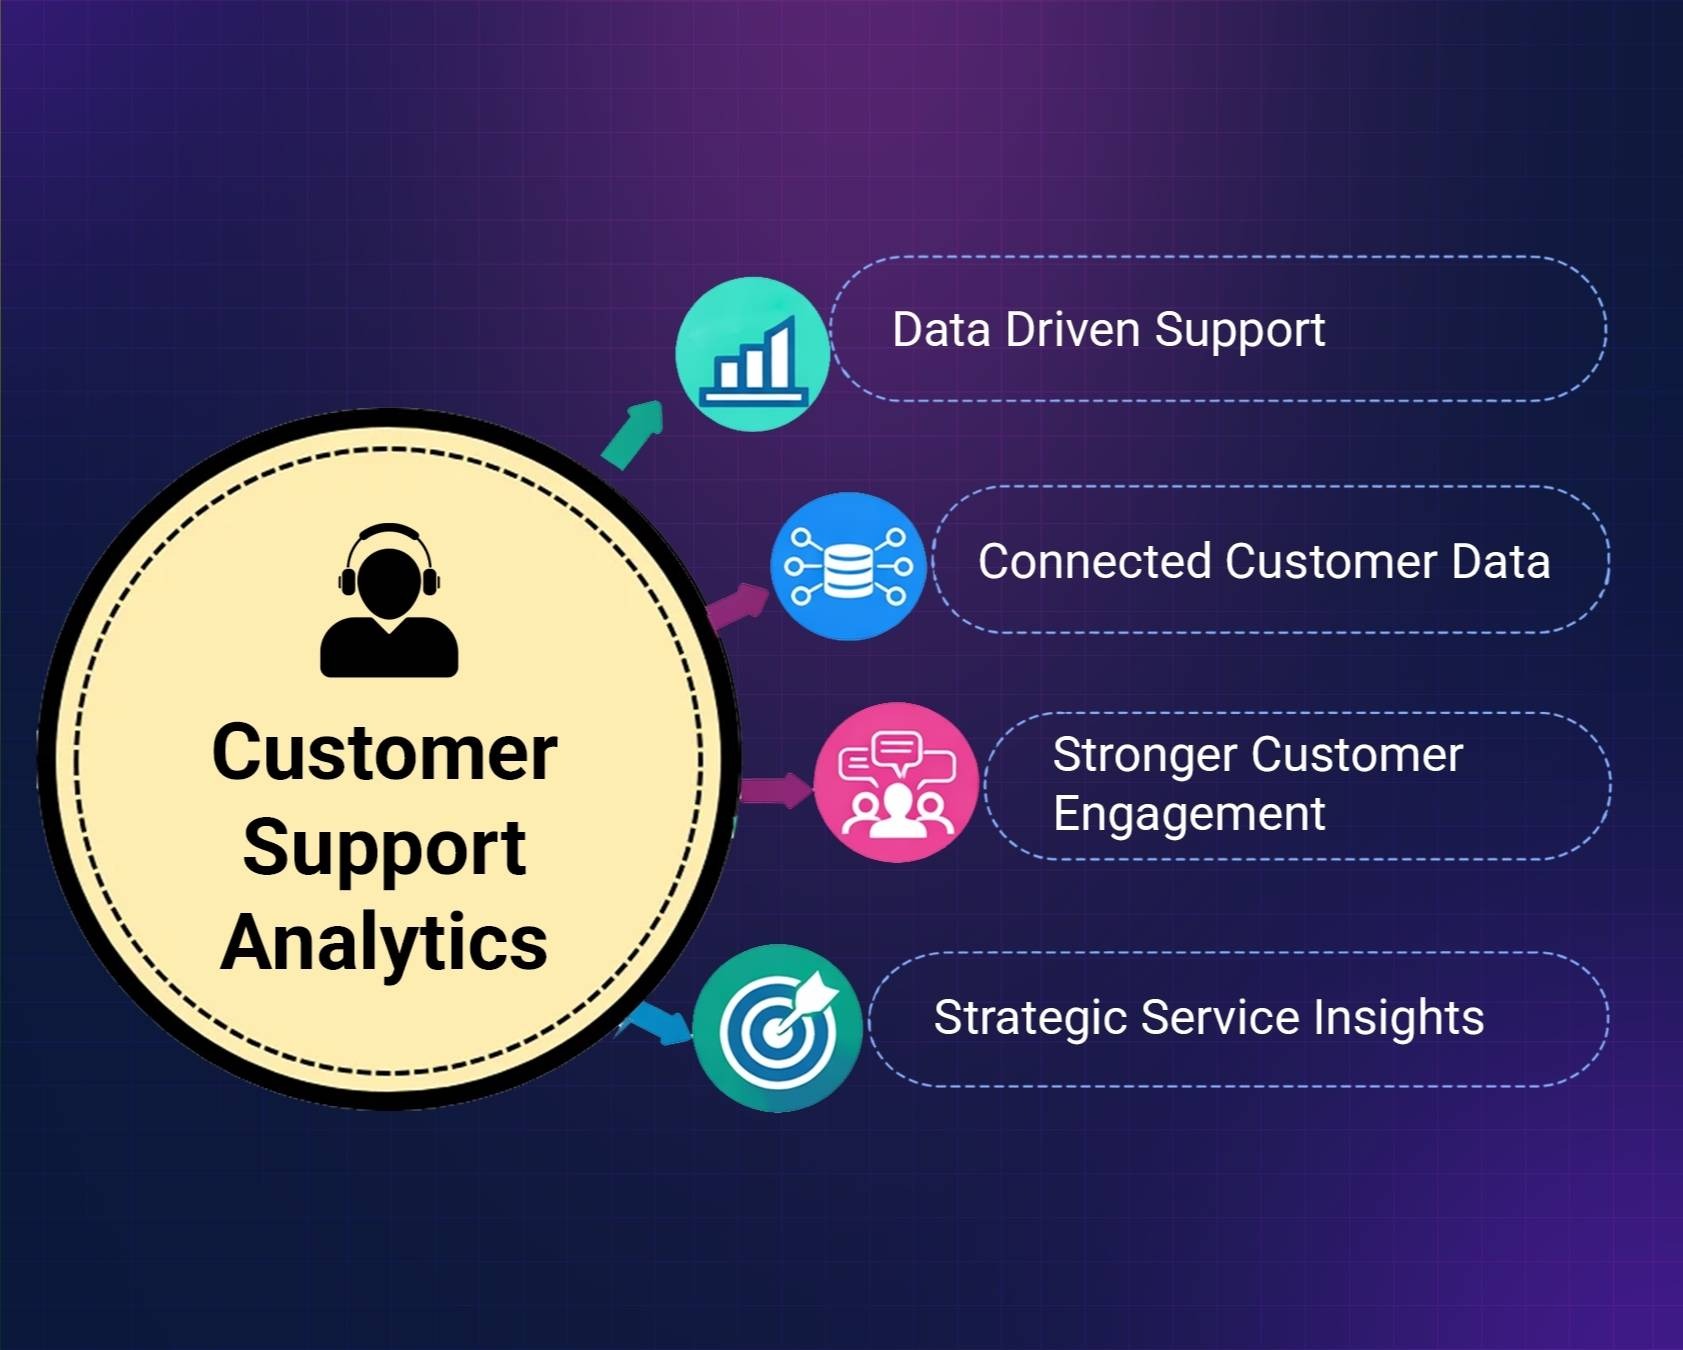
Data Driven Support
Businesses now depend on customer support analytics to understand how their customer support teams perform across different service channels. By analyzing customer service data, companies gain visibility into how requests move through support workflows and where delays occur. Many customer service analytics businesses rely on detailed reports to evaluate service quality and identify areas for improvement.
Advanced customer analytics platforms help teams study customer behavior and identify patterns across service requests. These insights help organizations improve support response strategies and align service delivery with changing customer expectations. When teams analyze support data regularly, they can identify gaps in service processes and respond quickly to evolving customer needs.
Connected Customer Data
Modern support platforms generate large volumes of customer service data analytics from tickets, conversations, and feedback forms. When organizations combine this information with past customer interactions and a customer's purchase history, they gain a clearer view of the entire support journey.
Understanding the customer relationship requires visibility into how customers interact with support teams across different service channels. These insights help organizations understand recurring customer issues, track product-related concerns, and design support workflows that improve service efficiency. Analyzing support data in this way also helps companies detect trends that might otherwise remain hidden.
Stronger Customer Engagement
Analytics also strengthens customer engagement by helping support leaders understand how customers communicate with service teams. By reviewing interaction data, companies can refine communication strategies and build support processes that respond more effectively to customer requests.
Support leaders analyze engagement patterns to improve customer service operations and ensure that support teams respond to issues consistently. These insights allow companies to develop support strategies that improve service responsiveness and build stronger connections with customers over time.
Strategic Service Insights
Organizations increasingly connect support insights with broader business activities such as marketing campaigns and product development initiatives. This integrated approach allows teams to identify recurring service challenges and address them through operational improvements.
Analytics insights also help teams drive customer satisfaction by highlighting opportunities to improve response times, refine support workflows, and strengthen communication with customers across different service channels.
Better Customer Experience
Companies that rely on analytics develop a stronger understanding of what defines good customer service for their users. By analyzing service performance data and monitoring support outcomes, teams can improve decision making and strengthen long term service strategies.
Customer support analytics ultimately helps organizations improve support efficiency, understand customer expectations, and deliver better service experiences while maintaining strong relationships with customers, especially when paired with resilient customer support team operations that can scale.
Types Of Customer Support Analytics
Support analytics becomes easier to understand when you break it into categories that answer different questions. What happened? Why did it happen? What might happen next? What should we do about it? Most tools in 2026 combine several of these types under the hood, even if they do not label them explicitly.
Descriptive Analytics
Descriptive analytics summarizes past activity in your customer support operations. It answers the question of what happened by showing ticket volume last month, average response time, how many chats came in during a product launch, or what percentage of customer issues were resolved on first contact.
The power of descriptive analytics lies in comparison. Looking at January 2024 versus January 2025 ticket volume tells you whether demand is growing. Tracking channel mix over 90 days shows whether customers are shifting from email to live chat or social media. These patterns inform staffing decisions and resource allocation.
Easy starter metrics include ticket volume by day, average handle time, customer satisfaction score percentage, and first contact resolution rate. A simple dashboard might display a line graph of daily ticket volume, a bar chart comparing channels like email versus chat versus social, and a table showing average response times by support channel. None of this requires a data scientist. Most helpdesk tools offer these summaries out of the box, and the broader benefits of using a ticketing system include organized workflows and clearer visibility into what is happening in your queue.
Diagnostic Analytics
Diagnostic analytics digs into root causes. When response times slowed in Q2 2025, diagnostic analysis might reveal the slowdown happened because of a new product release that created unfamiliar customer issues, combined with understaffing on weekends when ticket volume spiked.
Practical diagnostic analysis involves segmenting metrics by product version, region, plan type, or customer segment. You look at common tags on tickets, such as “login issue” versus “billing question” versus “connectivity problem,” to see where problems cluster. This kind of slicing and dicing does not require a data analyst. A support manager can do it with spreadsheet exports and basic filters.
Consider a company that noticed a rise in refund requests during spring 2025. Diagnostic analytics revealed that customers tagged with “pricing confusion” had refund rates three times higher than average. Digging deeper showed the issue started after a pricing page redesign in April. The fix was straightforward: clarify the pricing page and add an FAQ. The analytics made the problem visible and quantifiable.
Predictive Analytics
Predictive analytics uses historical patterns to estimate future events. It helps you forecast ticket volume for Black Friday 2025 based on data from 2022 through 2024, predict which customers might cancel based on repeated questions about account deactivation, or project staffing needs during upcoming peak periods.
Even simple trend lines and moving averages are powerful. A three-month moving average of incoming tickets can show an upward trend that warrants hiring before the backlog becomes overwhelming. You do not need complex machine learning from day one. Start with what you have and layer on sophistication as your team grows.
Predictive analytics helps with customer retention analytics by identifying at-risk customers before they leave. Customers who have contacted support multiple times with low customer satisfaction scores, high customer effort score, or explicit cancellation questions can be flagged for proactive outreach. This is where analyzing data translates directly into preventing customer churn and addressing common customer service challenges and their solutions before they grow into bigger problems.
Prescriptive Analytics
Prescriptive analytics moves from “here is a pattern” to “here is a recommended action.” It combines diagnostic and predictive insights to suggest specific next steps, like adjusting ticket routing rules, creating help center content around a trending topic, or triggering outreach when certain conditions are met.
Examples include automatically routing tickets tagged “urgent billing” to a senior agent queue, recommending temporary staffing changes when backlog passes a certain threshold, or initiating a proactive success call when a customer’s churn risk score climbs too high.
You can build simple playbooks: if churn risk score is high, trigger an outreach email and schedule a success call within 48 hours. If backlog exceeds a threshold and oldest tickets are over a certain age, alert the team lead for immediate action. These are concrete ideas you can test within the next month.
Customer Journey And Experience Analytics
Customer journey analytics tracks the full path customers take with your company, from trial sign-up through onboarding, first invoice, and renewal. It overlays customer support data onto this timeline to show where support tickets cluster along the entire customer journey.
Specific journey stages worth monitoring include trial sign-up, onboarding during week one, first invoice in month two, and renewal at month twelve. Customer experience analytics shows where friction happens at each touchpoint. If most high-value accounts open tickets during the first 10 days after onboarding and again just before renewal, you know where to focus resources.
Combining support data with CRM data reveals customer lifetime value by journey stage. You might discover that enterprise customers with high ticket counts and low customer effort score during onboarding risk churning unless they receive additional coaching. That insight drives action: assign a dedicated success manager during onboarding for enterprise accounts.
Agent Performance Analytics
Agent analytics should be used to coach and support your customer support teams, not just monitor them. The goal is helping agents improve while maintaining a culture where people feel valued rather than surveilled.
Relevant customer service metrics include first response time by agent, resolution rate, customer satisfaction score by agent, tickets handled per week, and adherence to internal service levels. But volume alone is misleading. Agents who handle complex tickets should not be penalized for taking longer if their quality remains high. Weight metrics by case complexity, channel, and priority to get a fair picture.
Consider how one team in 2025 used analytics to design a training plan. Data showed new agents had lower CSAT scores specifically on billing topics. Rather than generic training, they provided focused coaching on the billing system. Metrics improved within 30 to 60 days. That is analytics driving meaningful change.
Key Metrics To Track In Customer Support Analytics
Teams do not need dozens of key performance indicators to improve. A focused set of core metrics, reviewed weekly and monthly, works better than tracking everything at once. The following sections give you a concrete list of what to measure and simple guidance on what good looks like.
Customer Satisfaction Score And Net Promoter Score
Customer satisfaction score measures how happy customers are immediately after a support interaction. You ask something like “How satisfied are you with the support you just received?” on a 1 to 5 scale or with thumbs up and thumbs down options. Calculate monthly CSAT as the number of satisfied responses divided by total responses, multiplied by 100.
Net promoter score nps measures broader customer loyalty by asking “How likely are you to recommend us to a friend or colleague?” on a 0 to 10 scale. Promoters score 9 or 10, passives score 7 or 8, and detractors score 0 through 6. NPS equals the percentage of promoters minus the percentage of detractors, and a dedicated CSAT and NPS score guide for support teams can help you interpret and act on these metrics.
One team tracked NPS changes before and after implementing a workflow change in mid-2024 that gave agents better access to their knowledge base. NPS increased by 10 points over the next two quarters. The numbers validated the investment.
Reading qualitative comments alongside scores matters as much as the numbers themselves. A CSAT score of 3 tells you something is off. The comment explaining why tells you what to fix.
Customer Effort Score
Customer effort score ces asks “How easy was it to solve your issue today?” typically on a 1 to 7 scale ranging from very easy to very difficult. Lower effort strongly correlates with customer loyalty and fewer repeat contacts.
Some interactions naturally require more effort than others. Password resets typically score low effort. Complex billing disputes score high effort. The insight comes from tracking trends over time. If customer effort score for your onboarding flow remains high for two consecutive months, that is a warning sign requiring attention.
Use CES trends to identify workflows that need simplification. Perhaps customers consistently struggle with a multi-step verification process or find your navigation confusing. Those patterns point to concrete improvements you can make.
Speed And Resolution Metrics
Speed matters, but not at the expense of quality. The key metrics here are first response time, average handle time, and first contact resolution.
First response time measures how long until a customer receives their initial reply. Average handle time includes total agent time: conversation, hold time, and internal wrap-up. First contact resolution tracks the percentage of tickets resolved without requiring follow-up from the customer.
Pushing average handle time down too aggressively creates problems. Agents rush, quality drops, and customers come back with the same customer issues unresolved. That generates more work, not less, and harms improved customer satisfaction.
One support team improved first contact resolution by 20% over three months by updating their macros and internal knowledge base. Agents found answers faster and resolved more issues on the first try. Repeat tickets dropped noticeably.
Retention, Churn, And Lifetime Value
Customer retention rate measures the percentage of customers you keep over a given period. Customer churn is the opposite: the percentage who leave. For a subscription product, if you start January with 1,000 customers and retain 900 by June, your retention rate is 90% and churn rate is 10%.
Customer lifetime value clv represents the total revenue expected from a customer over their entire relationship with your company. It factors in average revenue per period, retention rate, and purchase frequency. Support leaders should care about CLV because support experiences directly influence how long customers stay and how much they spend, making it essential to select the right customer support metrics, KPIs, and best practices to track business impact.
Tracking whether customers with low customer effort score and high CSAT stay longer and spend more validates your support investments. It connects the work your customer service teams do every day to revenue outcomes leadership cares about.
Sentiment And Topic Analysis
Sentiment analysis uses natural language processing to scan customer conversations and label them as positive, negative, or neutral. Tracking customer sentiment over time reveals mood trends across channels, agents, or time periods. A sudden spike in negative sentiment after a product update signals a problem worth investigating.
Topic or tag analysis groups tickets into themes like “shipping delay,” “integration issue,” or “pricing confusion.” Monitoring how each theme changes month to month helps you identify trends and allocate resources appropriately.
Even manual tagging, done consistently, provides valuable insights while teams grow into more advanced analytics tools. The key is consistency. When everyone tags tickets the same way, the raw data becomes useful for data driven decision making.
Practical Use Cases For Customer Support Analytics
Most support teams in 2026 recognize these scenarios: ticket backlogs that pile up during busy periods, self-service gaps that generate unnecessary contacts, at-risk customers showing warning signs, and uneven agent workloads creating burnout. Each use case below focuses on how analytics reveals what is happening and what action you can take within 30 to 60 days.
Reducing Ticket Backlog And Response Times
Picture a product launch where your backlog doubles overnight. First response time creeps from 2 hours to 12 hours. Customers get frustrated. Agents feel overwhelmed, which is where automated ticket management software to reduce response time can make a measurable difference.
Volume analytics by hour and day of week reveals exactly when tickets pile up. Maybe weekends see 40% more incoming contacts than weekdays. Maybe the post-lunch period creates a consistent bottleneck. That data, combined with strategies to cut average resolution time fast, guides staffing decisions: add temporary coverage during peak hours, shift schedules to match demand, or implement routing rules that distribute load more evenly.
Track backlog trends over a specific period like Q4 2024, then test new automation or routing rules in early 2025. Measure the change over 30 to 60 days. Did average response time improve? Did the backlog stay manageable? These are concrete outcomes you can point to.
Improving Self Service And Help Center Content
Search analytics from your help center reveal what customers look for and whether they find it. Topics from tickets show what questions generate support contacts even when articles exist, highlighting the value of smarter helpdesk setups for smoother support that keep content and workflows aligned.
Look for gaps: popular search queries with no helpful article, or articles that exist but still lead to tickets because they do not solve the problem. One team noticed a spike in “invoice download” tickets every month-end. They wrote a clear step-by-step article with screenshots. Over the next two billing cycles, those tickets dropped significantly.
Review deflection rates quarterly. How many help center views lead to resolved customer needs without a ticket? What is customer satisfaction like for users who found answers through self-service versus those who contacted support? These data driven insights shape your content strategy.
Identifying At Risk Customers Before They Churn
An at-risk customer often shows warning signs before leaving. They have repeated high-effort contacts, low CSAT on recent tickets, and questions about cancellation or pricing across different channels. They may express frustration about unmet customer expectations or ask about competitors, which is easier to spot when you run multi-channel customer support with the right tools.
Combining these signals creates simple churn alerts. When a customer matches the at-risk profile, trigger a follow-up action: a personalized email acknowledging their frustration, a proactive success call offering to help, or an offer that addresses their specific customer pain points.
Track the percentage of at-risk customers who stay after outreach over a 3 to 6 month window. That measurement validates whether your intervention works and helps you refine your approach.
Coaching Agents And Building A Stronger Support Culture
Analytics uncovers coaching opportunities when you look at individual patterns. An agent with high CSAT but slower handle times might need workflow tips to improve operational efficiency. A fast agent with lower satisfaction scores may benefit from soft skills training on handling difficult customer calls.
Use one-on-ones to review a small set of metrics together with real conversation examples. Keep the data human and fair by contextualizing numbers. An agent who handles complex escalations should not be compared directly to someone handling simple password resets, and using the best ticketing software system for customer support can give you the nuanced reporting needed for fair comparisons.
Measure the impact of training by checking metrics again 30 to 60 days later. Sustainable improvement takes time, and showing agents their progress builds confidence and engagement.
How To Get Started With Customer Support Analytics
If you do not have a data background, starting with customer support analytics can feel intimidating. The good news is you can begin small and see value within a few weeks. You do not need a data warehouse or analytics specialists.
Start with a simple plan. Pick 3 to 5 metrics that matter most to your team: perhaps CSAT, first response time, backlog count, ticket volume, and churn risk. Set up basic dashboards using your existing support tools. Most platforms in 2026 offer built-in reporting that requires no technical setup, especially modern helpdesk ticketing software with analytics features that make customer support metrics and KPIs easy to track.
Review these metrics weekly. Look for patterns and anomalies. Then run one improvement experiment each month. Change one autoresponder to see if it reduces unnecessary replies. Improve one help article that generates frequent tickets. Update one routing rule to balance agent workload better. Measure the effect after 30 days.
The foundation for good analytics is clean data. Ensure consistent tagging of topics so tickets labeled “billing” mean the same thing to everyone. Use accurate timestamps so response time calculations reflect reality, which becomes far simpler once you streamline customer support with ticket automation. Agree on definitions as a team: what counts as “resolved” or “backlog”? When reports mean the same thing to everyone, decisions become easier.
Implementing customer service analytics does not require perfection. Start where you are, improve incrementally, and build from there.
How EasyDesk Helps Teams Turn Analytics Into Better Support
For small and mid-sized businesses, building dashboards from scratch is rarely practical. You need tools that surface valuable insights without requiring dedicated reporting staff. That is where EasyDesk’s secure and efficient customer support platform fits in.
Centralized Ticket And Channel Management
EasyDesk brings together tickets, live chat, social media messages, and other customer service channels into one unified dashboard. Instead of switching between platforms to piece together the full picture, support teams see everything in one place. This centralization makes analyzing customer interactions straightforward because all your support data lives together, and the EasyDesk helpdesk ticketing software features are designed specifically for this kind of multi-channel visibility.
Built-In Reporting And Trend Visibility
EasyDesk tracks support trends, team performance, ticket volume, and channel mix through ready-made dashboards. Support leads can filter by channel, tag, priority, or time period to understand what is driving workload. Trend views show how support performance changed between 2023, 2024, and 2025, making it easy to spot improvements or catch problems early, especially when combined with the best ticket management system capabilities EasyDesk provides.
Self-Service Tools With Content Analytics
The built-in knowledge base includes analytics that show which articles customers view most, what search terms they use, and where content gaps exist. Combined with customer feedback from post-interaction surveys, these insights help teams prioritize which help center content to create or improve next. Canned responses save time on repetitive answers, freeing agents to focus on complex customer conversations, especially when you also turn emails into trackable tickets with the right tools.
Automation And Workflow Efficiency
Automated routing rules, SLA alerts, and intelligent prioritization help teams respond faster without manual overhead. If tickets tagged “urgent billing” should go to senior agents, EasyDesk makes that rule simple to configure. When backlog thresholds are crossed, alerts ensure team leads know immediately. These features, similar to broader automated ticket management software capabilities, support the kind of prescriptive analytics that turns insights into action.
FAQs
How Much Data Do I Need Before Customer Support Analytics Becomes Useful
Even a few hundred customer conversations per month are enough to start spotting patterns. You can identify common question types, peak contact times, and recurring customer issues without massive volume. Very small teams can start with quarterly reviews to find meaningful trends, then move to monthly and weekly reviews as volume grows. The key is consistency in how you capture and tag data, not the total amount.
Do I Need A Dedicated Data Analyst To Use Customer Support Analytics
Most modern tools in 2026 are built for non-analysts. Pre-built dashboards and simple filters let support managers handle reporting on their own without SQL skills or spreadsheet expertise. Start by using the built-in reports in your support platform before considering specialist hires. Many teams find they can drive significant improvements with the analytics features already included in their helpdesk software, especially when they adopt EasyDesk features for smarter, secure customer support.
How Often Should I Review My Support Metrics
A practical cadence includes quick daily checks on live queues and response times to catch emerging problems, weekly reviews of core KPIs like customer satisfaction and backlog to track progress, and deeper monthly reviews examining trends and root causes. Quarterly reviews work well for revisiting goals, comparing against past periods, and setting priorities for the next quarter. This rhythm keeps analytics actionable without overwhelming your schedule.
Which Channels Should I Include In My Support Analytics
Include every channel where customers ask for help: email, in-app chat, web chat, social media DMs, phone calls, and even app store reviews that contain support questions. Combining all customer service channels gives a complete picture of the full customer experience, and comparing the best multichannel helpdesk software options in 2026 can help you choose tools that preserve context across those channels. Looking at email or chat alone misses interactions that happen elsewhere and creates blind spots in your understanding of customer needs.
How Do I Avoid Overwhelming My Team With Too Many Metrics
Pick a small set of primary KPIs and treat everything else as supporting detail. For most teams, CSAT, first response time, backlog count, and churn rate cover the essentials. Agree on definitions and targets together as a team so everyone knows which numbers matter most and why. When everyone focuses on the same metrics, discussions become more productive and foster customer loyalty through consistent service quality.