Customer support teams handle hundreds or even thousands of customer inquiries every month. But answering tickets is only half the battle. Businesses also need to know whether their support efforts actually improve customer satisfaction, strengthen customer relationships, and contribute to long-term business success. That is where customer support KPIs become essential.
Customer support KPIs help measure service quality, response speed, operational efficiency, and customer loyalty. From first contact resolution and average resolution time to customer satisfaction score (CSAT) and net promoter score (NPS), each metric provides valuable insights into how well a customer service team meets customer expectations. Tracking the right customer service KPIs helps identify problems early, improve customer experience, and create more satisfied customers.
In this guide, you will learn the most important customer support KPIs, how to calculate them, and how to use them to improve customer service performance.
What Are Customer Support KPIs And Why Do They Matter?
Customer support KPIs are measurable values that show how well a customer service team performs. They help businesses track customer satisfaction, response time, service quality, and operational efficiency. Unlike general customer service metrics, key performance indicators focus on the results that directly support business objectives. They show whether your customer support team meets customer expectations and delivers effective customer service.
Tracking customer support KPIs helps identify strengths, uncover gaps, and improve customer service performance. Metrics such as customer satisfaction score (CSAT), first contact resolution (FCR), average resolution time, and customer retention rate provide valuable insights into customer interactions and support outcomes. They also help customer service agents handle customer inquiries more effectively and resolve customer issues faster.
The right customer service KPIs do more than measure performance. They help strengthen customer relationships, improve customer experience, increase customer loyalty, and support long-term business success. Without tracking KPIs, it becomes difficult to know whether customer service efforts are creating real business value.
Customer Support KPIs Vs Customer Support Metrics
Customer support KPIs and customer support metrics are closely related, but they are not the same. Metrics track specific activities and outcomes, while KPIs focus on the measurements that directly support business objectives. Understanding the difference helps teams focus on the numbers that truly impact customer satisfaction, customer retention, and overall customer service performance.
Customer Support KPIs | Customer Support Metrics |
|---|---|
Directly tied to business objectives and company success | Measure day-to-day support activities and performance |
Focus on strategic outcomes | Focus on operational data |
Help evaluate overall customer service performance | Help monitor specific support processes |
Usually reviewed by managers and leadership teams | Often reviewed by supervisors and customer service agents |
Track long-term business value and customer loyalty | Track short-term performance trends |
Examples: CSAT, NPS, Customer Retention Rate, FCR | Examples: Ticket Volume, Wait Time, Average Handle Time, Repeated Contact Rate |
Used to assess whether customer service efforts are successful | Used to identify areas that need operational improvement |
Support decision-making and resource allocation | Support daily management and workflow optimization |
15 Essential Customer Support KPIs Every Team Should Track
No single metric can tell the full story of customer support performance. A strong customer service team tracks a mix of customer satisfaction, efficiency, loyalty, and operational metrics. Together, these customer support KPIs provide valuable insights into customer experience, service quality, and overall business success.
1. Customer Satisfaction Score (CSAT)
CSAT measures customer satisfaction after a specific support interaction. Most companies collect it through a simple survey that asks customers to rate their experience.
The score is calculated as the percentage of satisfied customers out of total responses. Research from HubSpot shows that 90% of customers consider immediate responses important when seeking support. A higher CSAT often reflects better service quality and stronger customer relationships.
2. Net Promoter Score (NPS)
Net Promoter Score measures customer loyalty and the likelihood of customers recommending your business to others. Customers answer a question on a scale from 0 to 10.
Customers who select 9 or 10 are promoters, while those who choose 0 to 6 are detractors. NPS is calculated by subtracting the percentage of detractors from promoters. This customer service KPI helps predict long-term growth and customer retention.
3. Customer Effort Score (CES)
Customer Effort Score shows how easy it is for customers to resolve issues or get support. Lower effort often leads to higher customer satisfaction.
Companies usually collect CES through post-support surveys. A high score indicates customers find it easy to get help. This metric helps identify friction points in customer communications and support processes.
4. First Contact Resolution (FCR)
First Contact Resolution measures how many customer issues are resolved during the first interaction. It is one of the most important customer service KPIs.
FCR is calculated by dividing first-contact resolutions by total issues and multiplying by 100. Studies show that even a 1% increase in FCR can lead to roughly a 1% increase in customer satisfaction. High FCR often means fewer repeat contacts and better customer experience.
5. First Response Time (FRT)
First Response Time measures how long customers wait before receiving the first reply from a customer service representative.
Customers expect quick responses, especially through live chat and social channels. A shorter response time builds trust and confidence, and the right customer support software can improve response time 3X by centralizing communication and automation. This metric varies across communication channels but remains a key measure of customer service performance.
6. Average Resolution Time (ART)
Average Resolution Time measures the total time required to fully resolve customer inquiries and support tickets, and optimizing average resolution time in customer support can significantly improve satisfaction and operational efficiency.
A lower ART usually indicates a more efficient support team. Tracking this KPI helps managers identify workflow bottlenecks and forecast staffing needs. Faster resolutions often lead to higher customer satisfaction and better operational efficiency.
7. Average Handle Time (AHT)
Average Handle Time measures the average time a customer service agent spends resolving an issue from start to finish.
The metric includes talk time, hold time, and after-call work. A lower AHT can improve productivity, but quality should never suffer. Balance is essential when evaluating customer service efforts.
8. Ticket Volume
Ticket volume shows how many customer support tickets arrive during a specific period, and structured ticket creation and management helps teams keep this flow organized and accountable.
A sudden increase may signal product issues, customer concerns, or growing customer interest. Tracking ticket volume helps customer service departments plan staffing levels and manage workloads more effectively, especially when they manage support tickets efficiently with EasyDesk.
9. Customer Retention Rate
Customer retention rate measures how many customers stay with a business over a defined period.
Retention is closely linked to revenue growth. Research from Bain & Company found that a 5% increase in customer retention can increase profits by 25% to 95%. Loyal customers often generate greater customer lifetime value than newly acquired customers.
10. Escalation Rate
Escalation Rate measures the percentage of customer issues transferred to senior agents, supervisors, or specialized teams.
A high escalation rate may indicate training gaps or complex customer issues. A lower rate often reflects stronger frontline support and more effective customer service agents.
11. Wait Time
Wait Time tracks how long customers wait before speaking with an agent or receiving assistance.
Long wait times can damage customer experience and lower customer satisfaction. Customers today expect fast service across every channel. Monitoring this KPI helps support teams meet customer expectations more consistently.
12. Repeated Contact Rate
Repeated Contact Rate measures how often customers contact support again about the same issue.
A high rate often points to incomplete resolutions or communication problems. Lower repeat contacts usually indicate better contact resolution and stronger service quality.
13. Cost Per Resolution
Cost Per Resolution shows how much it costs to resolve a customer issue.
The formula divides total support costs by the number of resolved tickets. For example, a team spending $10,000 monthly and resolving 1,000 tickets has a cost per resolution of $10. This metric helps evaluate the ROI of customer support initiatives and budget planning.
14. Abandonment Rate
Abandonment Rate measures the percentage of customers who leave a queue or hang up before receiving support.
The formula is (Calls Received – Calls Handled) ÷ Calls Received × 100. Most contact centers aim to keep abandonment rates below 2%. Rates above 5% are generally considered unfavorable and may indicate staffing or service issues.
15. SLA Compliance Rate
SLA Compliance Rate measures how often a support team meets its promised service-level targets.
This KPI helps businesses track accountability and service consistency. Strong SLA performance improves customer trust, supports high customer satisfaction, and ensures the customer support team delivers on expectations.
How To Calculate Customer Support KPIs With Formulas And Examples
Customer support KPIs become far more useful when you know how to calculate them. Formulas turn raw customer service data into actionable insights and help you measure customer satisfaction metrics in a consistent, repeatable way. A few simple calculations can reveal customer satisfaction levels, service quality, operational efficiency, and opportunities to improve customer experience.
Customer Satisfaction Score (CSAT)
CSAT measures customer satisfaction after a specific support interaction. Most customer service teams collect feedback through a short survey. Customers usually rate their experience on a scale from satisfied to dissatisfied, and a dedicated CSAT score guide for support teams can help refine how you collect and use this data.
Formula:
CSAT = (Satisfied Responses ÷ Total Responses) × 100
For example, if 450 out of 500 customers report a positive experience, your CSAT score is 90%. Research from HubSpot shows that 90% of customers consider an immediate response important when they have customer issues. High CSAT often reflects effective customer service and stronger customer relationships.
Net Promoter Score (NPS)
Net Promoter Score measures customer loyalty and the likelihood of customers recommending your business. It helps predict future growth and long-term customer retention.
Formula:
NPS = % Promoters − % Detractors
Suppose 60% of respondents are promoters and 15% are detractors. Your NPS would be 45. Customers who score 9 or 10 are promoters, while those who select 0 to 6 are detractors. A strong NPS often signals high customer satisfaction and loyal customers who support business success.
First Contact Resolution (FCR)
First Contact Resolution tracks how many customer issues are resolved during the first interaction. It is one of the most important customer support metrics because customers value quick solutions, and it sits alongside other core customer service KPIs for support teams that define overall performance.
Formula:
FCR = (First Contact Resolutions ÷ Total Issues) × 100
For example, if a customer support team resolves 800 of 1,000 customer queries on the first contact, the FCR rate is 80%. Industry research shows a close link between FCR and customer satisfaction. In many cases, a 1% increase in FCR can lead to a similar increase in CSAT.
Customer Retention Rate
Customer retention rate shows how many customers stay with your business over a specific period. It is a key performance indicator tied directly to customer loyalty and business value.
Formula:
Customer Retention Rate = ((Customers At End Of Period − Customers Acquired) ÷ Customers At Start Of Period) × 100
For example, a company starts with 1,000 customers, gains 100 new customers, and ends with 950 customers. The retention rate is 85%. Research from Bain & Company found that a 5% increase in customer retention can increase profits by 25% to 95%.
Cost Per Resolution
Cost per resolution measures how much a business spends to resolve each customer support ticket. It helps evaluate customer service performance and support ROI.
Formula:
Cost Per Resolution = Total Support Costs ÷ Total Resolved Tickets
For example, if a customer service department spends $10,000 per month and resolves 1,000 tickets, the cost per resolution is $10. Tracking this KPI helps businesses manage budgets, improve operational efficiency, and identify opportunities to automate routine tasks without hurting service quality.
Customer Support KPI Benchmarks And Industry Standards
Tracking customer support KPIs is useful, but benchmarks provide context. A metric means little without a target to compare against. Industry standards help customer service teams understand whether their performance meets customer expectations or needs improvement.
Customer Satisfaction Score Benchmark
CSAT is one of the most common customer service KPIs. Most companies aim for a score above 75%, while top-performing customer support teams often achieve 80% to 90%.
A higher customer satisfaction score usually reflects better service quality and stronger customer relationships. Scores below industry averages may indicate customer concerns, slow response time, or poor customer service experiences. Regular customer feedback helps teams identify areas that need attention.
Net Promoter Score Benchmark
Net Promoter Score benchmarks vary by industry. However, an NPS above 30 is generally considered good, while scores above 50 are often viewed as excellent.
A strong net promoter score shows high customer loyalty and a greater likelihood that customers will recommend your brand. Since promoters often become loyal customers, NPS remains an important customer service metric for long-term business success and customer retention.
First Contact Resolution Benchmark
Many customer service departments target a first contact resolution rate between 70% and 79%. World-class support organizations often exceed 80%.
High first contact resolution means customer issues are solved without follow-up contacts. This improves customer experience and reduces workload for customer service agents. Research consistently shows that customers value quick solutions more than lengthy support processes.
First Response Time Benchmark
Customers expect fast replies. According to HubSpot research, 90% of customers rate an immediate response as important when they have customer inquiries.
For live chat, many businesses target less than one minute. Email support often aims for under one hour, while social media channels typically target responses within 15 to 60 minutes. Faster response time helps improve customer satisfaction and customer trust.
Abandonment Rate Benchmark
Abandonment rate measures how many customers leave before reaching a support representative. Most contact centers aim to keep this metric below 2%.
A call abandonment rate above 5% is generally considered unfavorable. Higher rates often signal long wait times, staffing shortages, or inefficient customer service efforts. A lower abandonment rate usually reflects better operational efficiency and a stronger customer experience.
How To Build A Customer Support KPI Dashboard That Drives Action
A customer support KPI dashboard should do more than display numbers. It should help teams spot trends, solve problems, and improve customer experience. A well-designed dashboard turns customer service metrics into clear actions that support business objectives and customer satisfaction, surfacing the most important customer service KPIs for support teams instead of overwhelming users with data.
Choose KPIs That Match Goals
Every dashboard should start with clear business objectives. The right customer support KPIs depend on what your company wants to improve. Some teams focus on customer retention, while others prioritize response time or service quality.
Too many metrics can create confusion. Focus on key performance indicators that directly impact customer satisfaction, customer loyalty, and operational efficiency. A small group of meaningful KPIs often delivers better insights than dozens of reports.
Group Metrics By Category
A dashboard becomes easier to understand when related metrics appear together. Categories help customer service teams quickly identify what needs attention and apply the right customer support metrics and KPIs to each area.
For example, place customer satisfaction score (CSAT), net promoter score (NPS), and customer effort score (CES) in one section. Keep first contact resolution, average resolution time, and escalation rate in another. This structure helps support teams review customer service performance faster and make better decisions.
Use Real-Time Data
Customer expectations change quickly. Real-time data helps customer service departments react before small issues become larger problems.
A sudden rise in ticket volume, wait time, or abandonment rate can signal staffing challenges or product issues. Fast visibility allows managers to take action sooner. Real-time dashboards also help customer service agents stay focused on current priorities rather than outdated reports.
Highlight Trends And Benchmarks
Numbers alone do not tell the full story. Trends show whether customer support performance is improving or declining over time.
Compare current results with previous months and industry benchmarks. For example, if your first contact resolution rate rises from 72% to 78%, the improvement becomes clear. Trend analysis provides valuable insights and helps teams understand the impact of customer service efforts.
Turn Insights Into Action
A dashboard should support action, not just reporting. Every metric should help answer an important question about customer experience or service quality.
If customer satisfaction drops, investigate customer feedback. If average resolution time rises, review workflows and customer communications. If repeated contact rate increases, look for gaps in contact resolution. A dashboard that drives action helps create satisfied customers, stronger customer relationships, and long-term business value.
Common Customer Support KPI Mistakes That Lead To Poor Decisions
Customer support KPIs help measure success, but they can also create problems when used the wrong way. Poor tracking methods often lead to bad decisions, lower customer satisfaction, and wasted resources. A few common mistakes can prevent a customer service team from seeing the full picture.
Focus On Too Many KPIs
Many customer service departments track every available metric. More data may seem useful, but it often creates confusion instead of clarity.
A dashboard filled with dozens of customer service metrics makes it harder to identify what truly matters. Focus on key performance indicators that support business objectives. Metrics such as customer satisfaction score, first contact resolution, customer retention rate, and response time usually provide the most valuable insights into customer service performance.
Ignore Customer Experience Metrics
Some businesses focus heavily on operational efficiency and overlook customer experience. Fast responses and low costs matter, but they are not the only measures of success.
A support team can close tickets quickly while still creating poor customer service experiences. Customer satisfaction, customer effort score (CES), and net promoter score (NPS) help show how satisfied customers actually feel. Strong customer relationships depend on both efficiency and service quality.
Use Metrics Without Context
A single KPI rarely tells the full story. Numbers need context before they can guide customer service strategies.
For example, a higher average handle time may seem negative at first. However, it could result from agents spending more time resolving complex customer issues during the first contact. Combining customer support metrics with customer feedback helps teams make better decisions and avoid false conclusions.
Track Results But Skip Action
Many teams collect data every month but fail to act on it. Reports alone do not improve customer service performance.
A drop in customer satisfaction CSAT should trigger an investigation. A rise in repeated contact rate may point to unresolved customer concerns. Every KPI should lead to action. Customer support teams gain the most value when data drives improvements in processes, training, and customer communications.
Measure Speed Over Quality
Speed is important because customers expect quick support. However, a strong focus on speed can sometimes reduce service quality.
Customer service agents may rush through customer interactions to meet response time targets. That approach can increase escalation rate, repeated contacts, and customer frustration. Effective customer service balances speed with accurate contact resolution. High customer satisfaction and loyal customers usually come from quality support, not just faster replies.
Best Practices For Improving Customer Support KPIs
Strong customer support KPIs should improve customer experience, not harm it. Many businesses focus only on numbers and forget the people behind them. The best customer service strategies improve efficiency, service quality, and customer satisfaction at the same time.
Use Self-Service Resources
Many customers prefer finding answers on their own before contacting a support team. A well-organized knowledge base, FAQ section, and help center can reduce customer support ticket volume and improve operational efficiency, especially when designed around self-service customer support best practices.
Research from Zendesk shows that a majority of customers prefer self-service options for simple issues. Self-service tools help customers resolve concerns faster. They also allow customer service representatives to spend more time on complex customer issues that require personal attention.
Invest In Agent Training
Well-trained customer service agents can resolve customer queries faster and with greater accuracy. Better skills often lead to higher first contact resolution, lower escalation rate, and stronger customer satisfaction CSAT scores.
Training should cover product knowledge, customer communications, and problem-solving skills. Employee satisfaction also plays an important role. Support agents who feel confident and supported are more likely to deliver outstanding customer service and create positive customer interactions, especially when they can rely on robust CSAT management tools in EasyDesk.
Act On Customer Feedback
Customer feedback provides direct insight into customer needs and expectations. Surveys, reviews, and support conversations often reveal issues that dashboards cannot show.
A low customer effort score CES or declining net promoter score may point to hidden problems. Businesses that act on feedback can improve customer experience and strengthen customer loyalty. Feedback also helps customer service departments make smarter decisions about future improvements.
Automate Routine Tasks
Routine tasks often consume valuable time. Automation helps customer support teams focus on work that requires human judgment and expertise, and following workflow automation best practices in customer support ensures these tools enhance rather than replace quality interactions.
Tasks such as ticket routing, status updates, follow-up emails, and data entry can often be automated, and setting up ticket automation workflows keeps these processes consistent even during peak demand. Automation improves response time and reduces manual effort, and dedicated automated ticket management software can make these gains measurable across channels. It also gives customer service representatives more time to focus on resolving issues and building stronger customer relationships.
Review KPIs On A Regular Basis
Customer expectations change over time. A KPI that mattered last year may not be the most important customer service metric today.
Regular reviews help teams align key metrics with current business objectives. Look at trends in customer retention, service quality, customer lifetime value, and support performance. Consistent KPI reviews provide valuable insights that support long-term business value and help maintain high customer satisfaction across the entire customer service department.
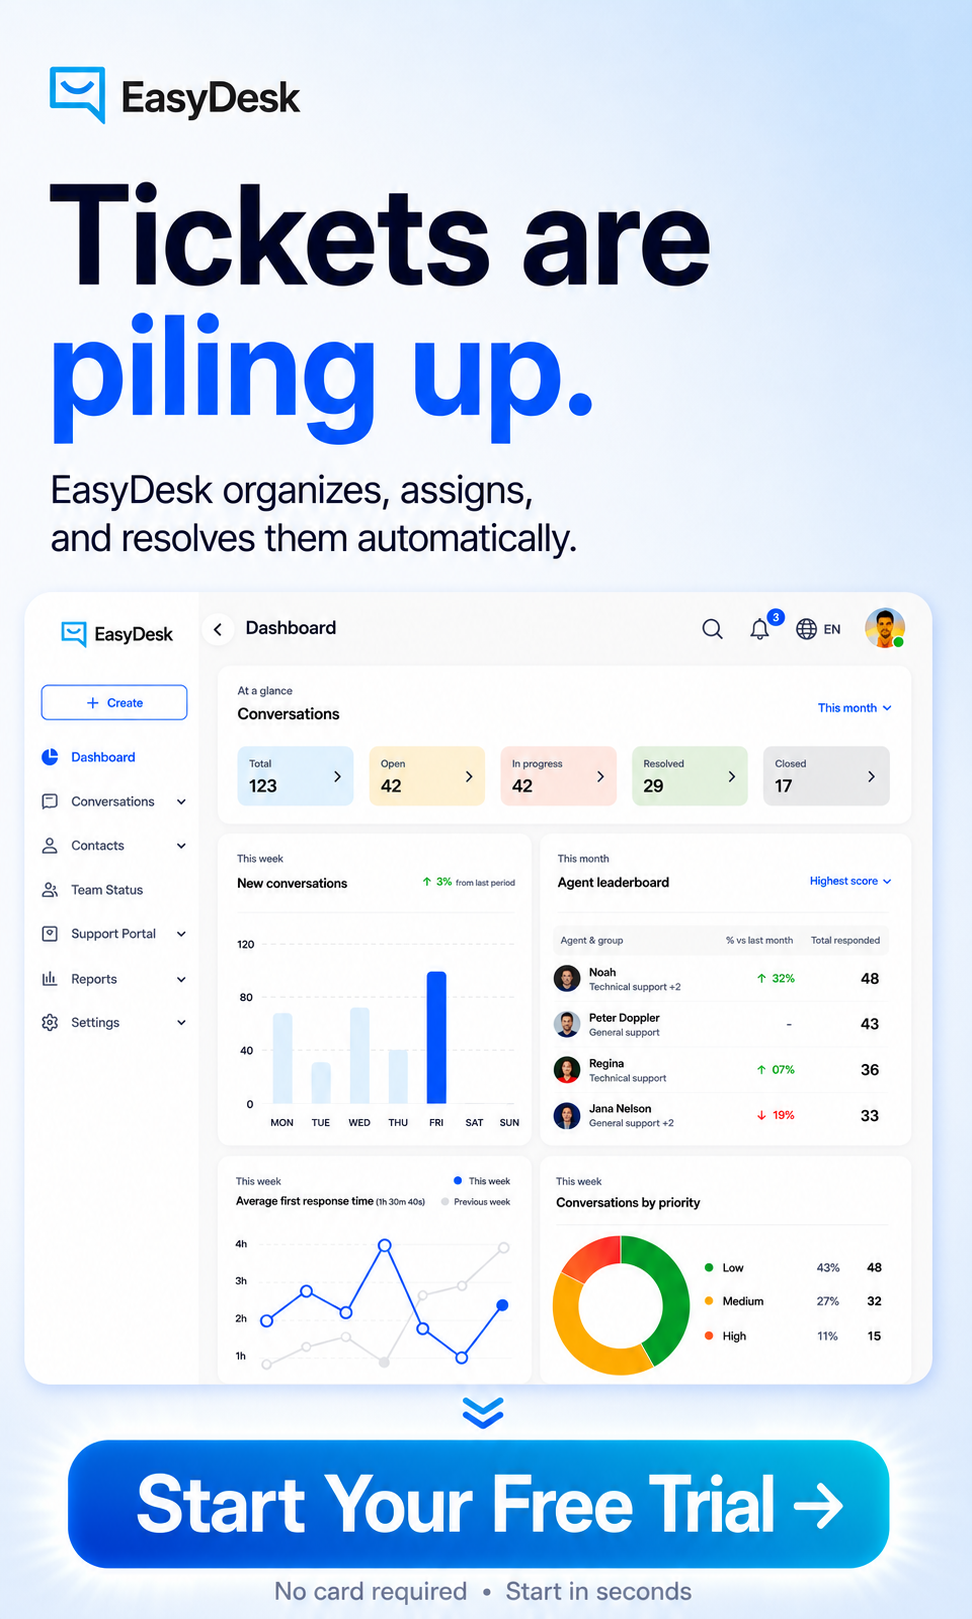
How EasyDesk Helps Improve Customer Support KPIs
Tracking customer support KPIs is important, but improving them requires the right tools and workflows. EasyDesk helps customer service teams monitor performance, streamline support operations, and deliver better customer experiences, staying true to its focus on secure, transparent customer support. With the EasyDesk customer support platform providing the right data and automation in place, teams can improve key metrics without sacrificing service quality.
EasyDesk gives support teams visibility into customer support metrics such as response time, first contact resolution, ticket volume, average resolution time, and customer satisfaction score, functioning as a modern help desk that improves support behind the scenes. Its smarter, secure customer support features and built-in reporting dashboards help managers track KPIs in real time and identify trends before they become larger issues.
The platform also supports automation for routine tasks, intelligent ticket routing, and faster customer communications. As a result, customer service agents spend less time on manual work and more time resolving customer issues. That leads to higher operational efficiency, stronger customer relationships, improved customer retention, and better overall customer service performance.
FAQs
Which Customer Support KPI Should Small Businesses Track First?
A small business should start with customer satisfaction score (CSAT), first contact resolution (FCR), and response time. These customer support KPIs provide quick insights into customer experience, service quality, and how well a customer service team meets customer expectations.
Can Customer Support KPIs Improve Revenue?
Yes. Strong customer support KPIs can directly impact business success. Higher customer retention, better customer loyalty, and improved customer satisfaction often lead to repeat purchases, stronger customer relationships, and greater customer lifetime value.
Do Customer Support KPIs Differ By Industry?
Yes. Customer service KPI metrics vary across industries because customer needs and service standards are different. For example, a contact center may focus heavily on wait time and average handle time, while a SaaS company may prioritize customer retention rate and customer effort score.
How Often Should Customer Support KPIs Be Reviewed?
Most customer service departments review operational metrics such as ticket volume and response time weekly. Strategic key performance indicators like net promoter score and customer retention are often reviewed monthly or quarterly to identify long-term trends.
Can Automation Help Improve Customer Support KPIs?
Yes. Automation can help customer support teams route tickets faster, automate routine tasks, and reduce response delays. This often improves operational efficiency, lowers average resolution time, and allows customer service agents to focus on more complex customer issues.