Customer expectations in 2026 are shaped by instant messaging, AI assistants, and 24/7 access. Support teams face pressure to deliver faster, more personalized service while managing growing ticket volumes. Between 2023 and 2025, many SaaS and ecommerce teams saw customer requests spike significantly, making clear performance targets essential for maintaining service quality and addressing emerging customer service challenges and their solutions.
Support benchmarks provide the structure your customer service team needs to measure what matters. Instead of vague goals like “respond quickly,” benchmarks give you specific targets such as “reply to all EU email tickets within 6 business hours” or “maintain 4.5+ CSAT on post-chat surveys.” This article walks through seven customer support benchmark metrics that EasyDesk customers can adapt for their own teams, complete with practical target ranges grounded in current industry data.
What Are Customer Support Benchmarks
Customer service benchmarks are measurable performance standards that define what good support looks like for your organization. For example, “90% of support tickets resolved within 24 hours” or “maintain customer satisfaction score above 4.3 quarterly” represent concrete benchmarks rather than abstract aspirations.
Companies typically base benchmarks on three inputs: historical EasyDesk data showing past performance patterns, peer and industry reports from 2024-2026, and internal business priorities like growth targets or cost controls. The difference between a metric and a benchmark is important. CSAT is a metric that records how satisfied customers are after each interaction. “CSAT above 4.3 in Q3 2026” is a benchmark that sets a target for that metric.
EasyDesk customers often create separate benchmarks by channel, language, or region. Live chat demands sub-3-minute responses while email allows 4-8 business hours for B2B contexts. This segmentation prevents unrealistic pressure on under-resourced channels and keeps targets achievable across diverse workloads, especially when you understand how customer support metrics and KPIs work together rather than in isolation.
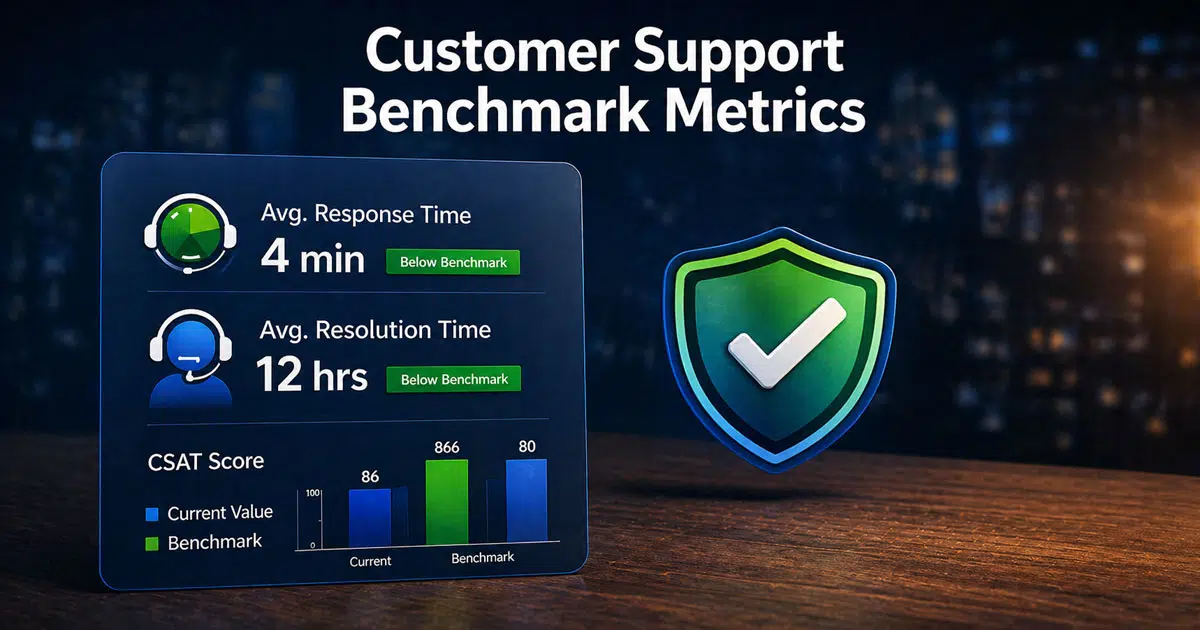
7 Customer Support Benchmark Metrics To Track In 2026
These seven key customer service metrics cover the full spectrum of support performance. They address speed through First Response Time and Average Resolution Time, quality through First Contact Resolution and CSAT, customer loyalty through Net Promoter Score, ease through Customer Effort Score, and reliability through SLA Compliance. Tracking all seven ensures you capture overall customer sentiment rather than optimizing one area at the expense of others, and a broader customer service KPIs guide for support teams can help you connect these metrics to business outcomes.
1. First Response Time Benchmarks
First Response Time measures the elapsed duration between a customer opening a ticket and receiving the first human or automated reply recorded in EasyDesk. This average response time directly impacts how customers perceive your support quality.
For 2026, channel-specific expectations vary significantly. Live chat should target under 2-3 minutes, which correlates with 88% CSAT potential. Social messaging should aim for under 15 minutes, while B2B email can allow 4-8 business hours. EasyDesk dashboards segment response times by queue or priority, letting you set stricter benchmarks for VIP or incident tickets.
Watch for common pitfalls like auto-replies that acknowledge but do not meaningfully help. EasyDesk reports can separate blank auto-responses from substantive first answers. Review these benchmarks quarterly, especially after product launches or seasonal peaks that affect ticket volume.
2. First Contact Resolution Rate Benchmarks
First contact resolution rate measures the percentage of customer conversations closed on the initial interaction without follow-up across chat, email, and phone support. High FCR indicates your customer support team resolves customer issues efficiently without requiring multiple touchpoints.
Realistic 2026 targets range from 70-80% for mature SaaS teams and 60-70% for complex technical support with multi-step fixes. EasyDesk automatically marks conversations as resolved when tickets close within a single threaded interaction, simplifying the contact resolution rate calculation.
Create separate FCR benchmarks for high-complexity cases like data migrations or billing disputes. Using one fixed target across all ticket types creates unfair evaluation for agents handling difficult customer queries. Pair FCR benchmarks with quality audits to ensure agents do not rush to close tickets just to hit a percentage, which can harm customer loyalty.
3. Average Resolution Time Benchmarks
Average resolution time calculates the mean duration between ticket creation and final closure, including necessary back-and-forth but excluding dormant archived cases. This metric reflects how quickly your team can fully resolve customer issues.
For 2026, typical benchmarks include resolving standard how-to questions within 4 hours, account changes within one business day, and complex engineering escalations within 3-5 business days. EasyDesk time tracking and status fields enable comparison of resolution times across categories like billing versus technical errors, and teams can apply proven ways to cut average resolution time fast to address the biggest bottlenecks.
The relationship between resolution time and customer satisfaction is strong. EasyDesk customers often see CSAT improve by 10-15 points when median resolution time falls below 24 hours. However, chasing extremely low targets at the cost of thoroughness backfires. Monitor reopen rates alongside this benchmark, as rushing can cause reopen rates to rise by 25%. Choosing the right ticketing software built for better customer support also influences how efficiently your team can reach these targets.
4. Customer Satisfaction Score Benchmarks
Customer satisfaction score CSAT captures post-interaction ratings collected through EasyDesk surveys on a 1-5 or 1-10 scale immediately after ticket closure. This metric directly measures how satisfied customers feel about specific service interactions, and a dedicated CSAT score guide for support teams can help you design surveys and interpret trends.
Target a CSAT of 4.5 or higher on a 5-point scale, or 90% or higher “satisfied or very satisfied” responses. Channel performance varies significantly. In-app support achieves 91% CSAT while email sits around 76% according to industry data. Self service options often outperform human support at 91% versus 88%.
Measure CSAT per channel and per queue to identify where you can improve customer satisfaction. Use written customer feedback from CSAT comments to refine macros and knowledge base articles. Require at least 100 positive responses monthly before treating a trend as statistically reliable for overall customer satisfaction tracking, and complement this with broader customer satisfaction metrics for support teams like NPS, CES, and retention.
5. Net Promoter Score Benchmarks
Net promoter score NPS measures overall loyalty using the 0-10 “likelihood to recommend” question. Unlike CSAT, which focuses on individual customer service interactions, NPS reflects customer sentiment about the entire customer experience with your company.
For 2026, aim for NPS above +40 for established SaaS vendors and above +30 for newer products. SaaS companies typically range from 30-60, with best-in-class achieving 70+. Historical trends from your own customer data matter more than cross-industry averages.
EasyDesk can schedule NPS campaigns quarterly, tagging respondents to link scores to past support experiences. This connection helps identify pain points in the customer journey. Compare NPS before and after major 2025-2026 product or pricing changes to ensure support quality mitigates disruption and prevents customers lost due to poor experiences.
6. Customer Effort Score Benchmarks
Customer effort score CES captures ratings on statements like “EasyDesk made it easy for me to resolve my issue” using a 1-7 agreement scale. This metric reveals friction in support processes that raw resolution times might miss.
Maintain an average CES of 5.5 or higher on a 7-point scale for standard support interactions. EasyDesk triggers CES surveys after both self-service flows and agent conversations, allowing comparison between guided and unguided customer experience.
Improvements in CES often come from workflow changes like reducing authentication steps or consolidating handoffs. Review CES by intent category, comparing password resets, plan changes, and bug reports to identify areas where customers still experience friction. These insights help you identify pain points and deliver targeted improvements.
7. Resolution Service Level Agreement Compliance Benchmarks
Resolution SLA compliance tracks the percentage of tickets resolved within pre-defined time targets established in your service level agreement. This metric ensures your support team meets promises made to customers and fits into a broader ticket SLA management strategy for fast, consistent support.
For 2026, target 95% or higher compliance for urgent tickets and 90% or higher for standard tickets across business hours. EasyDesk allows defining multiple SLA policies by priority, customer tier, or region, automatically tracking whether each ticket meets its target, effectively acting as a full SLA management system with automation and reporting.
SLA benchmarks protect both customers and support teams by clarifying response and resolution promises. Use SLA breach reports in EasyDesk to spot recurring causes such as specific workflows, integration issues, or time zone coverage gaps. These insights drive process improvements rather than blame and reinforce why well-structured SLAs matter for service success.
How To Set Realistic Support Benchmarks
Setting achievable support benchmarks requires grounding targets in your actual workflows rather than copying generic industry numbers. The following framework helps you establish benchmarks that drive improvement without creating unrealistic pressure on your customer service professionals, and a broader customer support team operations guide for 2026 can help you align benchmarks with structure and workflows.
Define Metrics That Reflect Real Support Work
Benchmarks must match your actual workflows, not abstract industry averages. Focus on key metrics like first response time, resolution time, CSAT, and backlog size that directly reflect how your team operates. A benchmark meaningful for a 50-person enterprise support team may be irrelevant for a 5-person startup.
Align metrics with your team capacity and support model. If you offer phone support only during business hours, your SLA targets should reflect that constraint. Match benchmarks to the service interaction patterns your customers actually experience.
Analyze Historical Support Data Before Setting Targets
Use past ticket data from EasyDesk to identify realistic averages and patterns. Historical analysis reveals peak hours, common delays, and workload trends that affect what targets are achievable. Setting targets without data-backed insights leads to frustration and missed goals.
Export past performance data to calculate medians and identify volume swings. Many teams see 20-50% variation in ticket volume throughout the year. Your benchmarks should account for these patterns rather than assuming constant workloads, and learning how to manage support tickets efficiently using EasyDesk will make those patterns easier to spot and act on.
Adjust Benchmarks Based On Ticket Volume And Complexity
Simple customer queries like password resets differ substantially from complex issues like data migrations. One fixed benchmark creates unfair evaluation and unnecessary pressure. A 70% FCR target works for how-to questions but may be impossible for multi-step technical escalations.
Implement tier-based or category-based benchmarks. EasyDesk tagging enables segmentation so you can track performance data separately for different issue types. This approach provides valuable insights while maintaining fair expectations across your team.
Align Benchmarks With Team Capacity And Resources
Team size, shifts, and workload distribution directly impact achievable performance. A small team cannot chase the same sub-1-hour resolution benchmarks as a large enterprise customer service team without risking burnout. Unrealistic targets erode employee satisfaction and increase turnover.
Consider role-based expectations where senior support handles complex escalations while newer agents manage simpler requests. This structure ensures customer needs are met without overwhelming individual team members, especially when supported by a clear ticket escalation process for faster support.
Continuously Review And Refine Benchmarks
Benchmarks should evolve with growth and operational changes. Static targets become irrelevant as AI adoption increases automation by 30-50% according to recent industry reports. What worked in 2024 may not fit your 2026 reality.
Use EasyDesk reporting to track performance and adjust targets monthly or quarterly. After adding new channels, launching products, or changing team structure, revisit benchmarks to ensure they remain achievable and meaningful for measuring operational efficiency, ideally supported by dedicated SLA management software for real-time monitoring.
How To Use Benchmarks To Coach Teams And Improve Processes
Benchmarks become powerful coaching tools when used constructively rather than as punishment. The following approaches help customer service professionals improve while maintaining team morale and driving genuine process improvements.
Use Benchmarks To Identify Performance Gaps
Compare individual and team performance against established benchmarks to spot areas needing attention. Focus on patterns rather than isolated mistakes. If an agent consistently struggles with resolution time on billing tickets, that reveals a training need rather than a performance problem.
Identify where delays or inefficiencies occur in the customer journey. EasyDesk dashboards highlight specific queues or ticket types where benchmarks are regularly missed, enabling targeted investigation into root causes, and SLA tracking software to improve response time can provide additional alerts and prioritization.
Provide Data Driven Feedback To Support Agents
Use real metrics from EasyDesk instead of subjective feedback. Citing specifics like “your FCR lags 10% on billing tickets compared to the team average” creates actionable discussion points. Vague feedback frustrates agents and fails to drive improvement.
Keep feedback constructive by focusing on how to close gaps rather than criticizing past performance. Benchmarks should never become punishment tools that threaten job security or create fear.
Recognize High Performers And Best Practices
Highlight agents consistently meeting or exceeding benchmarks. Recognition reinforces positive behavior and builds team morale. More importantly, extract repeatable behaviors and workflows that others can adopt.
If one agent consistently achieves 15% faster resolution times, investigate their approach. Perhaps they use specific macros or follow a particular conversation structure. Encourage knowledge sharing across the customer support team through peer sessions.
Improve Processes Based On Benchmark Insights
Benchmark data often reveals bottlenecks in workflows like handoffs, approvals, or escalation delays. These process issues inflate resolution times by 50% in some cases. Optimize processes instead of blaming individuals when systemic problems exist.
Use insights to refine ticket routing or response flows within EasyDesk. Better routing can deliver 15-20% improvement in resolution times without requiring agents to work harder, especially when you adopt automated ticket management software to reduce response time. Focus on removing obstacles that prevent happier customers.
Track Progress And Measure Coaching Impact
Show how performance improves over time after coaching interventions. EasyDesk dashboards and reports visualize trends across specific periods, demonstrating whether changes are working. Teams that track coaching impact see 12% CSAT improvements on average.
Reinforce a continuous improvement culture where benchmarks guide growth rather than creating anxiety. Celebrate milestones like hitting 95% SLA compliance for three consecutive months to maintain momentum.
Common Mistakes When Interpreting Support Benchmarks
Even well-designed benchmarks can mislead when interpreted incorrectly. Understanding these common mistakes helps support leaders use performance data effectively without creating unintended consequences for their teams or customer relationship management.
Benchmarks As Fixed Targets
Benchmarks should serve as guidance, not rigid requirements for every scenario. Ticket complexity varies significantly, and context matters. A complex technical issue that takes three days to resolve properly should not be judged against the same standard as a simple account question.
Maintain flexibility based on situation. External factors like third-party integration outages or customer behavior patterns affect achievable response time and resolution metrics in ways beyond agent control.
Context Behind The Numbers
Raw metrics alone have limits. Without understanding ticket type, customer behavior, and external factors, numbers can mislead. An agent with lower FCR might consistently handle the most difficult escalations while colleagues work simpler new customers inquiries.
Prevent unfair agent comparisons by ensuring like-for-like analysis. EasyDesk tagging enables proper segmentation so you compare similar support request types across agents rather than aggregate numbers that obscure important differences.
Speed Over Quality Focus
Prioritizing response speed over resolution quality hurts overall customer sentiment. Teams that obsess over average time metrics often see CSAT drop 10% despite achieving faster responses. Customers prefer thorough answers over quick but incomplete ones.
Balance efficiency with experience by tracking quality metrics alongside speed metrics. Resolution without satisfaction creates repeat business problems as existing customer relationships erode through poor experiences.
Benchmarks As Pressure Tools
Overusing benchmarks as pressure tools damages team morale by up to 30% according to workplace studies. A threat-based performance culture drives talented agents away and creates anxiety that actually impairs performance.
Promote a supportive coaching approach where benchmarks inform development conversations rather than disciplinary actions. Teams that feel supported by their key performance indicators outperform those who fear them.
Outdated Benchmark Use
Static targets become irrelevant as operations evolve. Benchmarks set in 2024 may be 25% off from appropriate 2026 targets given AI integration, channel expansion, and changing customer expectations. Using outdated standards creates confusion.
Collect data regularly to refresh benchmarks. Align targets with current operational realities rather than historical assumptions. EasyDesk historical comparisons make it straightforward to see when previous targets need adjustment.
Why EasyDesk Is Built For Modern Support Benchmarks
EasyDesk aggregates customer service metrics across email, chat, voice, and in-app messages, enabling unified benchmarks for your entire support operation. This seamless integration eliminates data silos that make cross-channel comparison difficult and showcases how a secure, efficient customer support platform underpins benchmark tracking.
The platform offers configurable dashboards with target lines, alerts when benchmarks are missed, and historical comparisons spanning multiple years. Features like SLA policy management, survey automation for CSAT, NPS, and CES, and tagging to segment results by product, plan, or region give you complete control over tracking important customer service metrics, all powered by EasyDesk’s smarter, secure support features.
EasyDesk customers can export benchmark reports for leadership reviews or board meetings, including 2024-2026 trend charts and cohort analysis. This performance data supports strategic decisions about retention strategies, staffing, and process improvements. Start aligning your 2026 support goals with EasyDesk’s reporting by creating a test dashboard that includes all seven core benchmark metrics from this article, and if you are still evaluating options, review our modern help desk solutions guide for 2026 to choose the right platform.
Frequently Asked Questions
How Often Should We Revisit Our Support Benchmarks
Revisit benchmarks monthly or quarterly based on trends in support metrics and ticket volume. Regular updates improve customer service performance and help teams adjust to changing customer interactions. Tracking how many support tickets arrive over a specific period keeps targets realistic and aligned.
Should We Use The Same Benchmarks For Every Channel
Each channel handles different customer interactions, so benchmarks should vary. Email, chat, and phone support require different response expectations. Align customer service KPIs and support metrics with channel behavior to maintain consistent service quality and avoid unrealistic performance standards.
How Do Benchmarks Change For Global Or Multilingual Teams
Global teams face different customer expectations, time zones, and language needs. Benchmarks should reflect regional differences in customer interactions and service quality. Adjusting targets helps maintain customer service performance while supporting better customer retention across diverse markets.
What Is The Difference Between Internal Targets And Public SLAs
Internal targets guide daily performance, while service level agreements define commitments shared with customers. Both rely on customer service KPIs and support metrics. Clear separation helps teams manage expectations while protecting brand reputation and ensuring consistent service delivery.
How Can Smaller Teams Use Benchmarks Without Overwhelming Themselves
Smaller teams should focus on a few high-impact support metrics instead of tracking everything. Prioritize customer interactions, response time, and resolution quality. This approach improves customer service performance and customer retention without creating unnecessary workload or complexity.