Customer support teams depend on clear data visibility to manage service operations and maintain consistent support quality. A well-structured customer service dashboard allows teams to monitor each support ticket, track response metrics, and evaluate the support team's performance from a centralized view. Many organizations create dashboards that combine information from multiple systems to simplify daily monitoring.
Businesses often review different customer service dashboard examples to design reporting views that match their operations. Some companies rely on a call center dashboard or a broader center dashboard to monitor service levels and improve customer service efficiency. Even industries such as aviation use an airline customer service dashboard to manage high volumes of requests.
A modern multi-channel customer experience dashboard also brings together customer dashboards, enabling managers to access real time insights, capture feedback quickly, and extract key takeaways for data driven decisions.
What Is A Customer Service Dashboard
A customer service dashboard is a daily management tool that displays key metrics from your support operations in one centralized view. It pulls data from ticketing systems, live chat platforms, and email inboxes to show you what matters most at any given moment.
Think of it as mission control for your customer service team. Instead of digging through multiple channels or waiting for monthly reports, you see the latest data on ticket status, response time, and customer satisfaction right away. Industry benchmarks show that top-performing teams maintain resolution rates around 70-80% and target customer satisfaction scores above 85%.
The real power of a service dashboard comes from its ability to surface critical metrics without manual effort. Teams using dashboards report cutting response delays by up to 30%, and 92% of support leaders now prioritize real time visibility for their daily operations. For a growing SaaS business, this means spotting a surge in customer queries after a product update and reacting within minutes rather than hours.
Why Support Teams Use Customer Service Dashboards
Support teams rely on dashboards to transform scattered data into actionable insights. Here is how dashboards help teams deliver consistent service quality and improve efficiency across different support channels.
Centralized Support Data Visibility
When your customer support teams handle email, chat, social media, and contact forms, keeping track of everything becomes a challenge. A customer service dashboard solves this by pulling information from multiple data sources into a single screen.
You no longer need to switch between platforms to check ticket volume or agent availability. Mid-sized support teams often handle 200-500 tickets daily across multiple channels. Without a centralized view, managers miss patterns and risk overlooking customer issues that need immediate attention.
The dashboard shows ticket backlogs, agent workload, and channel breakdowns at a glance. This visibility prevents oversight and helps you connect multiple data sources for a complete picture of your support operations.
Faster Decisions With Real Time Metrics
Real time data changes how quickly you can respond to problems. When your dashboard updates every 30-60 seconds, you spot volume spikes immediately and adjust staffing before service levels drop.
Consider a scenario where chat requests suddenly triple during a product launch. With real time metrics, the team leader sees this spike and redistributes agent workload within minutes. Without this visibility, customer queries pile up and response time suffers.
Teams using live dashboards make informed decisions 22% faster than those relying on batch reports that lag by 24 hours. This speed matters when customers feel frustrated waiting for help, and automated ticket management software further reduces delays by routing and prioritizing requests instantly.
Multi Channel Customer Interaction Tracking
Modern customers reach out through email, chat, social media, and phone. Tracking customer interactions across these multi-channel customer support digital channels reveals which support channel performs best and where problems occur.
Dashboards segment performance by channel, showing that chat often achieves 90% first contact resolution rate compared to 65% for email. This detailed information helps you allocate resources and train agents for the channels that need the most attention, especially when you manage support tickets efficiently using EasyDesk across all those channels.
Without omnichannel tracking, you miss the full picture of your customer service experience. Some channels may resolve issues faster while others create friction that affects customer retention.
Clear Performance Monitoring For Support Teams
Dashboards make agent performance transparent and fair. You see who handles the most tickets, who maintains the highest customer satisfaction, and who might need additional training or support.
Performance metrics like 10-15 tickets resolved daily create clear benchmarks. Color-coded displays show workload distribution, helping managers prevent burnout by ensuring no single agent carries an unfair share of the queue.
This visibility supports coaching conversations grounded in actual data rather than assumptions. Agents meeting 95% SLA compliance typically see 15% higher satisfaction scores, creating clear goals for continuous improvement.
Continuous Service Improvement Through Insights
Looking at trends over weeks and months reveals patterns that daily snapshots miss. Recurring issues might account for 30% of your total ticket volume, and identifying these patterns helps you fix root causes.
A dashboard focuses on forward-looking analytics, not just historical records. You can forecast demand peaks, compare current performance against industry benchmarks, and identify trends before they become problems.
Teams that regularly monitor these insights achieve efficiency gains of 18-25% year over year. This continuous improvement cycle keeps your customer experience quality high as your business grows.
Top Customer Service Dashboard Features For Support Performance
Not every dashboard feature deserves space on your main screen. The best dashboards highlight what matters for daily operations and help you take action quickly.
1. Real Time Ticket Volume Monitoring
Knowing how many tickets are coming in right now is fundamental to managing your support queue. Real time ticket volume monitoring shows inbound requests as they arrive, typically averaging 200-500 daily for small to mid-sized teams.
The dashboard displays key data through line charts and counters that update continuously. You see trends forecasting the next 24 hours, helping you anticipate busy periods before they overwhelm your team. When volume hits 150% of normal levels, alerts trigger so managers can respond immediately.
This feature prevents the common problem of discovering a backlog only after customers start complaining. For SaaS businesses, ticket surges often follow product updates or marketing campaigns. Seeing these patterns in real time lets you staff appropriately and maintain resolution speed.
2. First Response Time Tracking
How quickly you acknowledge a customer query sets the tone for the entire support interaction. First response time tracking monitors the average time between ticket creation and first agent reply.
Industry benchmarks place good first response time between 1-4 hours, though chat channels often target much faster turnaround. The dashboard shows averages per agent and per channel, revealing outliers who need attention.
Histograms visualize distribution so you see not just averages but the full range of response times. Teams that maintain first response under 2 hours typically score 10 points higher on customer satisfaction surveys. When targets are missed for more than 10% of tickets, visual alerts highlight the problem.
3. Ticket Resolution Time Analytics
Average resolution time tells you how long customers wait for complete solutions, not just initial responses. This metric typically ranges from 8-48 hours depending on issue complexity and priority level.
Resolution time analytics break down performance by ticket type, priority, and agent. Pareto charts reveal which issue categories take longest, helping you focus improvement efforts where they matter most. High-impact issues taking 48+ hours deserve process review.
Tracking this metric alongside satisfaction scores shows the relationship between speed and customer experience. Faster resolution generally correlates with higher satisfaction, though rushing through complex issues can backfire.
4. Customer Satisfaction Score Monitoring
Customer satisfaction scores measure how customers feel about their support experience after resolution. Post-interaction surveys typically target 80-90% satisfaction, with leading teams pushing above 90%.
The dashboard displays CSAT as a prominent gauge or trend line, making it impossible to ignore. You see how scores connect to other metrics like resolution time and first call resolution, identifying the drivers of satisfaction.
Linking satisfaction data to specific agents or ticket types surfaces coaching opportunities. A 1-point improvement in CSAT can improve customer retention by 5%, making this one of the most valuable metrics to regularly monitor.
5. Service Level Agreement Performance Tracking
Service level agreement tracking ensures you meet the commitments made to customers or internal stakeholders. SLA compliance typically targets 90-95%, with the dashboard showing current status and at-risk tickets; dedicated SLA tracking software enhances these capabilities with automation and real time alerts.
Breach radars highlight tickets approaching their SLA deadline, giving agents time to prioritize before deadlines pass. For B2B companies, SLA failures can trigger contract penalties, making this visibility essential for operational efficiency.
Automated alerts notify team leaders when SLA risk rises, enabling proactive reassignment. Teams with strong SLA tracking achieve 25% better adherence than those managing manually, especially when supported by a robust SLA management system that standardizes rules and reporting.
6. Support Queue And Backlog Visibility
Your support queue shows tickets waiting for attention right now. Backlog visibility reveals how many tickets have been waiting too long and need immediate action.
Kanban-style views display 50-200 pending tickets with aging analysis flagging items stuck for 7+ days. This view helps managers prioritize without missing older issues that frustrated customers have been waiting on.
Queue visibility reduces backlogs by 40% when teams use it for daily prioritization. You see exactly what needs attention today rather than discovering problems during monthly reports.
7. Agent Productivity And Workload Insights
Understanding agent productivity helps you balance workload fairly and identify training needs. Productivity insights show tickets resolved per day, typically ranging from 10-15 for experienced agents, and case studies on how EasyDesk improved response time for a growing team illustrate the impact of better visibility and automation.
Pie charts and bar graphs display workload distribution across the team. When one agent handles 40+ tickets while others manage 10, redistribution prevents burnout and ensures consistent service quality.
These insights support fair performance evaluation based on actual data. Managers identify top performers for mentoring roles and spot agents who need support before satisfaction scores suffer.
Key Metrics Displayed In Customer Service Dashboards
Choosing the right key performance indicators determines whether your dashboard drives action or collects dust. Focus on metrics that connect directly to customer experience and team performance.
Ticket Volume And Support Demand Trends
Ticket volume trends show daily, weekly, and seasonal patterns in customer queries. Understanding demand helps you staff appropriately and plan for predictable busy periods.
Dashboards display volume as line graphs with comparison to previous periods. You see whether today is busier than normal or following expected patterns. This context prevents overreacting to routine fluctuations while ensuring genuine spikes get attention.
For SaaS businesses, correlating volume trends with product releases or marketing campaigns reveals which activities generate support load.
Average First Response Time
Average first response time measures the typical wait before customers hear back. This metric appears prominently because it directly affects customer sentiment and satisfaction.
Best-in-class teams maintain first response under 2 hours for email and under 5 minutes for live chat. The dashboard shows current averages against targets, highlighting when performance drifts.
Trend lines reveal whether response time is improving or declining over weeks, supporting continuous improvement efforts.
Average Resolution Time
Average resolution time tracks how long complete solutions take, from ticket creation to final resolution. This metric ranges from 12-48 hours depending on support complexity, and dedicated strategies to cut average resolution time fast can significantly boost customer satisfaction and efficiency.
Cohort analysis links resolution time to agent experience levels, showing whether newer team members need additional training. Targets typically aim for under 24 hours to maintain 85%+ satisfaction.
First Contact Resolution Rate
First contact resolution rate measures the percentage of issues solved without requiring follow-up interactions. High-performing teams achieve 70-85% FCR, keeping customer effort score low, and often rely on the benefits of using a ticketing system to organize and resolve requests efficiently.
This metric appears as a percentage tile with trend indicators. Improving FCR reduces repeat contacts and improves how customers feel about your support experience.
Knowledge base utilization often correlates with FCR, as better self-service resources help agents resolve issues faster.
Customer Satisfaction Score
Customer satisfaction score aggregates feedback from post-resolution surveys into a single performance indicator. Targets typically exceed 85%, with top teams reaching 90%+; a dedicated CSAT score guide for support teams helps you interpret results and plan improvements.
The dashboard connects satisfaction to other metrics, revealing the drivers of positive and negative experiences. Net promoter score often accompanies CSAT for a fuller picture of customer loyalty.
How Support Managers Use Dashboard Insights
Dashboards provide key insights that transform how support managers make decisions. Here is how leaders turn data into better daily operations and team performance.
Agent Performance Evaluation
Dashboard insights make performance conversations objective and constructive. Managers see resolution rates, satisfaction scores, and productivity metrics for each team member, drawing on a broader set of customer satisfaction metrics for support teams to guide coaching.
Rankings highlight top performers achieving 15+ tickets daily with high satisfaction, while also revealing agents struggling with 5 tickets or low scores. This data supports targeted coaching rather than generic feedback.
Fair evaluation based on actual performance builds trust and motivates improvement across the team.
Team Workload Distribution
Balanced workload prevents burnout and maintains service delivery quality. Dashboards show ticket distribution across agents, highlighting imbalances before they cause problems.
When one agent handles twice the average load, managers redistribute work immediately. This proactive approach prevents satisfaction dips that occur when overwhelmed agents rush through tickets.
Workload visibility also supports vacation planning and shift scheduling, ensuring coverage remains adequate.
Peak Support Demand Analysis
Understanding when demand peaks occur helps managers schedule appropriately. Heatmaps reveal that certain hours or days consistently generate more volume.
Peak analysis improves staffing accuracy by 20-25%, ensuring agents are available when customers need them most. This data also supports decisions about automation and self-service investments.
Escalation And SLA Risk Alerts
Automated alerts notify managers when tickets risk breaching SLA targets or require escalation. This proactive approach prevents 90% of potential SLA failures.
Risk alerts include predicted breach time, allowing prioritization before deadlines pass. Managers can reassign tickets or provide additional resources to handle complex issues.
Operational Support Efficiency Reports
Weekly and monthly efficiency reports show progress toward business goals. Managers track year-over-year improvements in resolution speed, satisfaction, and productivity.
These reports support conversations with leadership about resource needs and process improvements. Benchmarking against industry standards provides context for interpreting results and highlights where SLA management software could strengthen reliability and compliance.
Customer Experience Insights From Support Dashboards
Beyond operational metrics, dashboards reveal deeper insights about customer experience and product health. These signals help you improve service delivery and retain customers.
Customer Feedback And Sentiment Tracking
Customer feedback goes beyond satisfaction scores to include written comments and sentiment analysis. Natural language processing identifies whether feedback trends positive, negative, or neutral, and tools like EasyDesk features for smarter, secure customer support help centralize and act on this feedback.
Sentiment tracking spots emerging problems before they appear in satisfaction scores. When negative sentiment rises around a specific topic, you can investigate and respond quickly.
This qualitative data complements quantitative metrics for a complete picture of how customers feel.
Recurring Support Issue Identification
Tag analysis reveals which issues account for the largest share of ticket volume. Often, the top 5 recurring issues generate 30% of all support requests, so a capable helpdesk ticketing software is essential for organizing tags and surfacing patterns.
Identifying these patterns helps you gather feedback about product problems and create knowledge base articles that deflect future tickets. Addressing root causes improves customer satisfaction while reducing support load.
Product Problem Pattern Detection
Support dashboards become early warning systems for product issues. When tickets about a specific feature spike, product teams need to know immediately.
Linking support data to product releases shows which updates create problems. This connection helps product teams prioritize fixes and improve future releases.
Customer Interaction Trends
Analyzing how customers interact with support reveals preferences and pain points. Some customers use multiple channels before finding resolution, indicating friction in your process.
Interaction trends show whether customers prefer chat, email, or self-service. Understanding these preferences helps you invest in the right channels and improve efficiency by adopting a ticketing software built for better customer support that unifies all preferred channels.
Customer Retention Signals
Low customer effort score and quick resolution correlate with higher retention. Dashboards surface at-risk customers who experienced difficult support interactions.
Proactive outreach to dissatisfied customers can recover relationships before churn occurs. Retention signals transform support from a cost center into a revenue protection function when paired with the best ticketing software system for customer support to track and follow up consistently.
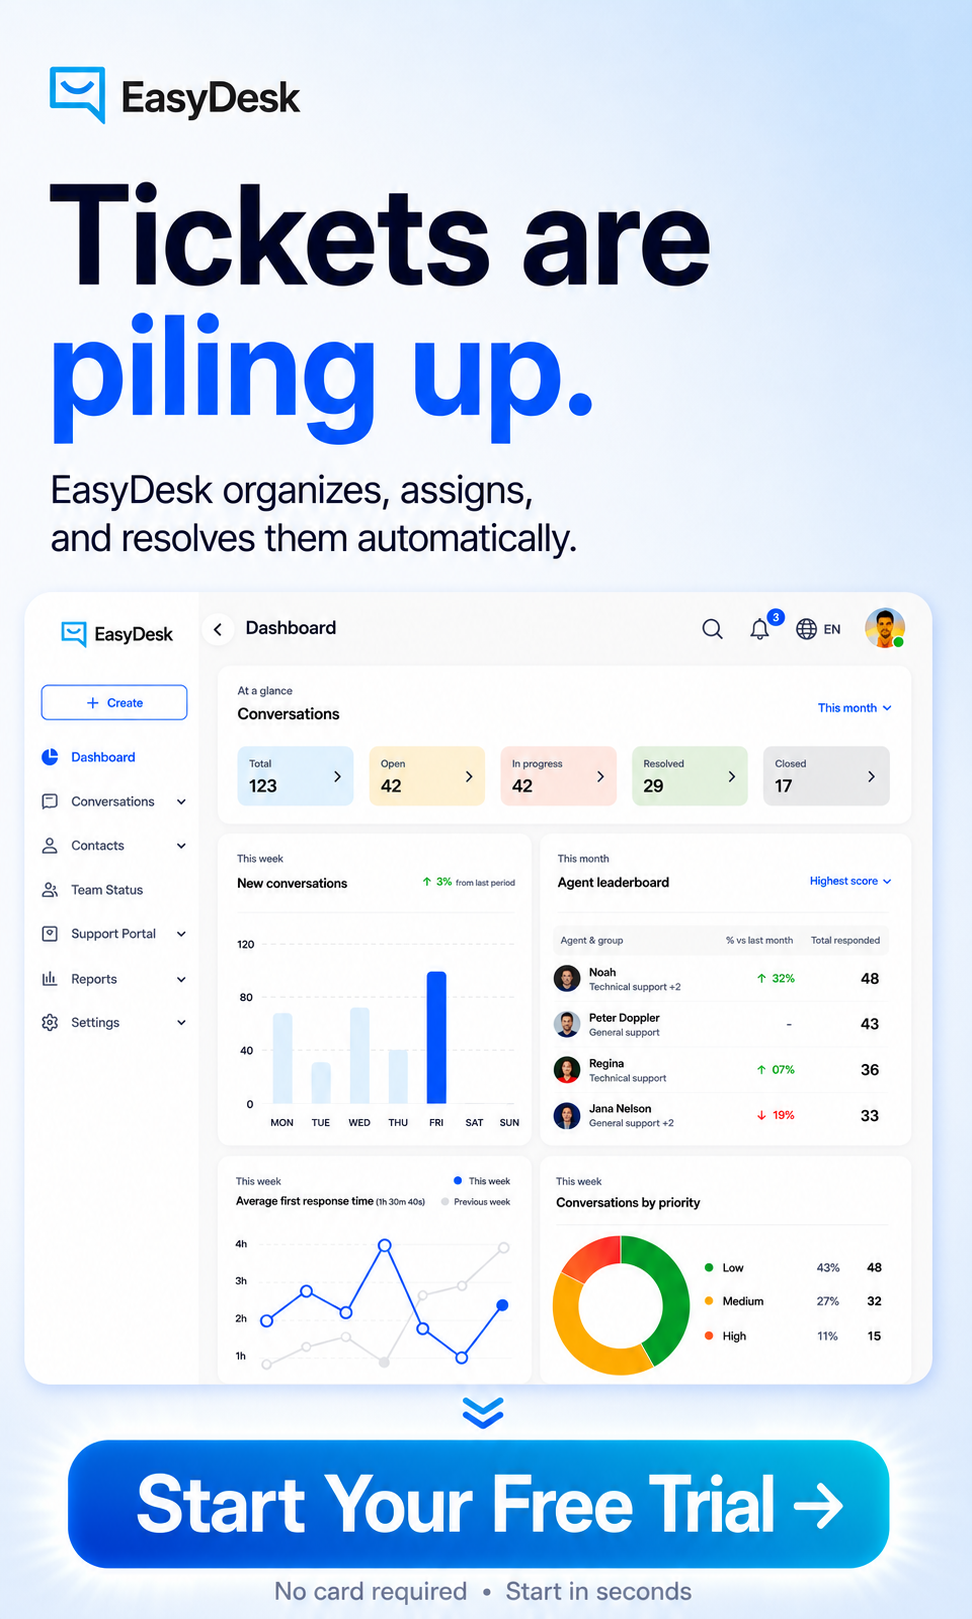
How EasyDesk Supports Customer Service Dashboards
EasyDesk’s customer support platform brings essential dashboard capabilities to startups and growing SaaS businesses without requiring complex setup or enterprise budgets. The platform centralizes email, live chat, and social support into one ticketing system, giving you a complete view of customer interactions across all channels.
Built-in dashboards track real time ticket queues, SLA performance, agent productivity, and customer satisfaction right from day one. Team leaders can create role-based views, showing managers the full operational picture while agents see their own queue and performance goals, all powered by the best ticket management system for growing teams.
SLA timers on tickets, automation rules for escalations, and knowledge base deflection reporting help you maintain consistent service quality as volume grows. You can connect your main support inbox and see your own data on an EasyDesk ticketing system dashboard within a single afternoon, with transparent customer support pricing plans that scale with your team.
Start your 14-day free trial to experience how proper dashboard visibility transforms your support operations and learn more about EasyDesk’s secure, transparent customer support.
Frequently Asked Questions
What Makes A Customer Service Dashboard Effective
An effective dashboard answers your most important questions within seconds of looking at it. The best dashboards display 10-15 key metrics that drive daily decisions, using clear visual hierarchy with big numbers for core KPIs and detailed charts for deeper analysis. Effectiveness comes from alignment with your actual workflow, not from fancy graphics that nobody checks.
Which Metrics Matter Most In Support Dashboards
The most valuable metrics include customer satisfaction score, first contact resolution rate, average resolution time, first response time, and ticket volume trends. These metrics directly connect to customer experience and operational efficiency. Pair speed metrics with quality metrics to avoid optimizing for fast but unhelpful responses.
How Dashboards Improve Customer Support Performance
Dashboards cut response delays by 25-30% by surfacing problems immediately rather than hiding them in batch reports. Teams see SLA risks before breaches occur and rebalance workload before agents burn out. This visibility creates accountability and enables the proactive management that keeps customers satisfied.
How Support Managers Use Dashboard Insights
Managers use insights for agent evaluation based on objective data, workload distribution to prevent burnout, peak demand forecasting for better scheduling, escalation alerts to prevent SLA failures, and efficiency tracking to demonstrate improvement over time. These insights turn reactive firefighting into proactive management.
Why Real-Time Data Matters In Customer Service Dashboards
Real-time data lets you respond to problems as they happen rather than discovering them hours or days later. When chat volume triples unexpectedly, you need to know immediately to adjust staffing. Batch reports that update daily miss the critical window for action, leaving customers waiting and satisfaction scores dropping.