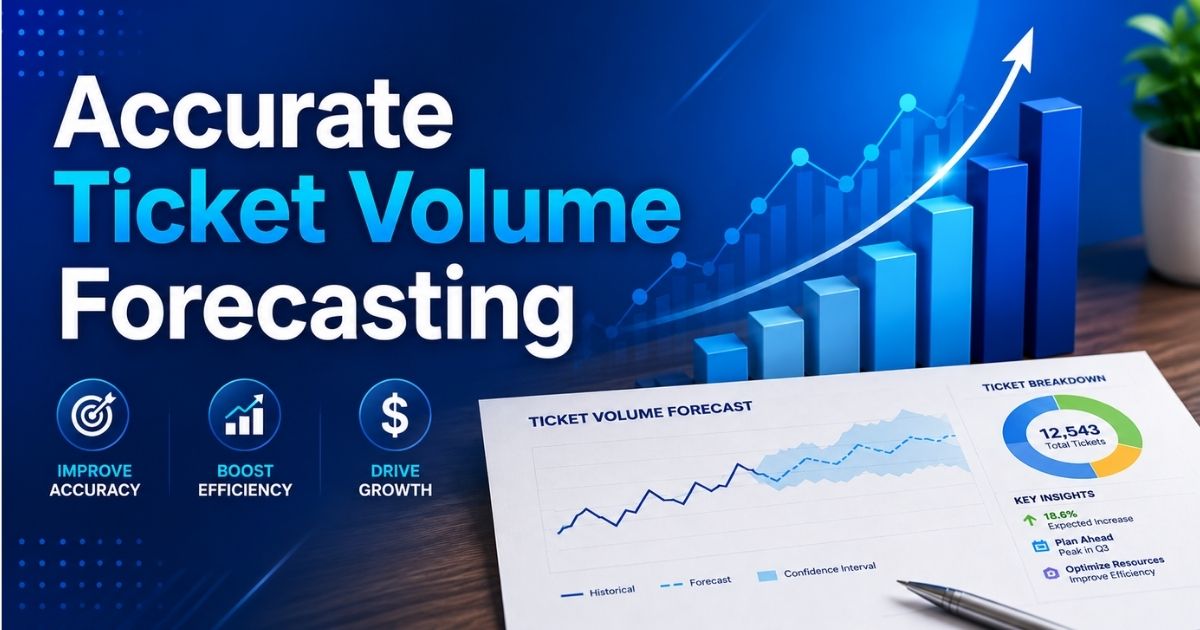
Planning headcount and budgets for Q4 2026 feels overwhelming when you do not know how many tickets your team will handle. That is where ticket volume forecasting strategies come in. When you can predict support demand with confidence, you reduce customer wait times, avoid overtime costs, and keep your team from burning out.
Think about preparing for a March product launch or Black Friday 2026. Without a solid forecast, you are guessing. With one, you can staff proactively and protect customer satisfaction scores. This article walks you through a practical forecasting framework that modern customer support teams use to plan. We will cover data collection, pattern recognition, staffing translation, and continuous validation.
What Is Ticket Volume Forecasting
Ticket volume forecasting is the practice of predicting how many tickets your support team will receive over a specific time period. This includes requests across email, chat, phone, and social channels. The goal is simple: know what is coming so you can prepare.
Customer service forecasting draws from historical data, growth projections, and upcoming events to build models that inform staffing decisions. When done well, it helps you hit targets like responding to 80 percent of tickets within one hour or keeping your backlog under 50 open cases. For a growing SaaS company, accurate forecasts mean the difference between smooth operations and scrambling to hire during a crisis.
Core Ticket Volume Forecasting Strategies
This section is the heart of your forecasting playbook. Each pillar below can be adopted over 90 days to build a complete system.
1. Clarify Your Forecasting Goals And Time Horizons
Before you pull any data, decide what you are forecasting for. Are you planning daily schedules, weekly coverage, or annual headcount? Each horizon serves a different purpose.
Short term forecasts covering the next 30 days help you build schedules and assign shifts. Long term forecasts spanning 6 to 12 months inform hiring decisions and budget requests. A SaaS support team might forecast weekly tickets for Q2 2026 to avoid weekend backlogs after feature releases.
Common forecasting goals include:
- Hitting 80 percent first response within one hour
- Keeping open tickets below 50 at any time
- Planning FTE needs for the next 12 months
- Preparing for seasonal fluctuations in Q4
2. Collect Clean Historical Ticket Data Across All Channels
Your forecast is only as good as your data. Start by pulling at least 12 to 24 months of historical ticket data from all channels. This includes email, chat, phone, in app messages, and social.
Remove noise before you analyze. Test tickets, duplicates, and automated alerts that never reach agents will skew your numbers. For example, you might pull 2024 and 2025 data from EasyDesk filtered by created date, channel, and issue category.
Key fields to standardize:
- Created a timestamp for intraday patterns
- Resolved time for handle time calculations
- Channel type and language
- Product area and customer segment
- Priority level for weighted forecasts
3. Identify Seasonal Patterns, Trends, And Recurring Spikes
Once your data is clean, visualize ticket volume by day of week, week of month, and month of year. Patterns will emerge quickly.
B2B tools often see 25 to 40 percent higher volume on Mondays as users catch up from the weekend. January brings contract renewal spikes. Fintech teams brace for tax season surges. Ecommerce support doubles during December holidays.
Plot a simple line chart comparing 2024 and 2025 volume for the same time period. This reveals year over year growth rates, often 10 to 25 percent for scaling companies. One team ignored December 2025 holiday patterns and saw a 40 percent backlog overrun with CSAT dropping from 85 to 72 percent. They learned the hard way that past data matters.
4. Map Ticket Volume To Product, Marketing, And Operational Events
Overlay your ticket timelines with release calendars, incidents, campaign launches, and pricing changes. This helps you separate organic growth from event driven spikes.
A May 2025 billing feature launch might produce a 60 percent spike in related tickets over three days. Once you tag that event, you can exclude it from baseline models and plan specifically for future launches.
Event categories every support leader should track:
- Software releases causing 20 to 50 percent spikes
- Outages amplify volume 5 to 10 times
- Marketing campaigns are boosting inquiries 15 to 35 percent
- Pricing changes are driving billing queries
- Policy updates adding steady lifts
Advanced teams use proactive release notes, customer emails, and ticket automation workflows for busy periods to cut post-release spikes in half.
5. Choose A Forecasting Method That Matches Your Maturity
Not every team needs machine learning. Match your method to your data volume and team size.
Small teams under 500 monthly tickets can use simple three month rolling averages. Mid sized operations benefit from moving averages with seasonality adjustments. Larger teams handling over 5,000 tickets monthly should consider AI driven models and shifting from manual to automated ticketing through tools like Assembled or built in EasyDesk analytics.
A practical example: use a four week moving average to forecast weekly ticket volume across Q3 2026 for a fast growing SaaS product. Add day of week multipliers to account for Monday spikes. This approach typically achieves 3 to 7 percent error rates compared to 10 percent or higher with simple averages.
6. Translate Ticket Forecasts Into Staffing And Scheduling Plans
Convert forecasted tickets into agent hours using average handle time and occupancy targets.
If you expect 1,200 tickets in a week in October 2026 with a 12 minute average handle time, you need 240 total agent hours. At 80 percent utilization and 40 hour weeks, that equals two full time equivalents. Use this formula to calculate agent capacity for any period.
Scheduling tactics tied to forecasted volume, combined with automated ticket assignment to balance workloads:
- Stagger shifts starting at 6 AM to cover Monday peaks
- Use split shifts for intraday volume dips
- Add 20 percent weekend buffer for Monday catch up
- Allocate more chat agents during launches and more email coverage for billing cycles
7. Continuously Validate, Adjust, And Communicate Your Forecasts
Compare forecasted versus actual ticket volume every week. Calculate your error percentage and track it over time.
Set checkpoints at 30, 60, and 90 days after rolling out a new model. One team revised their Q1 2026 forecast after a January underestimation of 18 percent due to a new integration launch. They blended historical data with event overlays and improved forecast accuracy by 15 percent.
Build a culture where support, product, and marketing review misses together. Forecasting is iterative. Small improvements each month compound into stable planning over the year.
Key Inputs That Drive Accurate Ticket Volume Forecasts
Accurate forecasting depends on the quality of inputs used to estimate future support demand. Missing critical signals leads to inaccurate projections, poor planning, and inefficient support operations. Reliable inputs help teams estimate support ticket volume, align resources, and prepare for expected changes in customer interactions, forming a foundation for scalable customer support team operations.
Historical Volume Data
Historical data provides the foundation for forecasting support ticket volume. Teams should analyze support tickets from the same time period in previous years to identify patterns and trends. Clean and categorized historical ticket data helps teams understand how many tickets typically occur during specific periods.
By comparing ticket volume across similar time periods, support teams can estimate future support tickets more accurately. This process also helps identify seasonal patterns and recurring issues that affect the number of tickets received.
Customer Growth Projections
Customer growth directly impacts support ticket volume. As the customer base expands, the number of customer interactions increases, leading to higher support tickets.
Customer service teams should work closely with growth and product teams to estimate how many tickets may result from new users, especially in small organizations that rely on a smart ticketing tool to keep up with demand. For example, a 30 percent increase in users may lead to a similar rise in support ticket volume unless offset by improved onboarding or automation. Understanding how many tickets to expect helps teams plan staffing and maintain service quality.
Product Roadmap
Product updates and feature releases often create spikes in support ticket volume. New features, changes in workflows, or updates in user interfaces can generate confusion or technical problems for users.
By aligning with product teams, support operations can anticipate increases in support tickets and prepare in advance. Forecasting based on product changes helps teams handle higher ticket volumes and ensure tickets resolved remain within acceptable timeframes.
Marketing Calendar
Marketing activities influence support ticket volume by driving new user engagement and inquiries. Campaigns often increase customer interactions as new users explore products or services.
Comparing ticket volume during previous campaigns helps teams estimate how marketing efforts impact support tickets. Customer service teams should collaborate with marketing teams to forecast expected ticket spikes and prepare support resources accordingly.
Pricing And Policy Changes
Changes in pricing, billing, or policies often lead to an increase in support tickets. Customers may raise questions about charges, plans, or policy updates, which directly impacts support ticket volume.
By reviewing past data and comparing ticket volume after similar changes, teams can predict how many tickets will result from new updates. These insights allow teams to prepare responses, improve communication, and ensure tickets resolved efficiently without overwhelming the support team.
How To Use Ticket Volume Forecasting To Improve Customer Experience
Accurate forecasting does more than support planning. It directly improves customer experience by reducing delays, preparing teams, and ensuring consistent service during demand spikes. When teams forecast support volume effectively, they respond faster and manage customer expectations with confidence.
Reduce Customer Wait Times
Forecasting helps teams prepare for spikes in support ticket volume before they happen. When teams know how many support tickets to expect, they can adjust staffing levels and reduce backlogs.
Lower wait times lead to faster resolutions and improved customer satisfaction. When support tickets move quickly through the system, customers experience fewer delays and better service consistency. Planning ahead also ensures that support operations maintain performance during peak periods.
Prepare Knowledge Base Updates
Forecasting allows teams to identify upcoming events that may increase support tickets. Product updates, feature releases, or interface changes often trigger a rise in customer questions.
Teams can update knowledge base software content and articles in advance to help customers find answers independently. Strong self service customer support options reduce the number of support tickets by enabling customers to resolve issues without contacting support. This approach leads to fewer tickets and better customer experience during high demand periods.
Train Agents Before Changes
Forecast insights help teams schedule training sessions before major changes. When agents understand upcoming updates, they handle customer interactions more effectively.
Well prepared teams resolve support tickets faster and require fewer follow ups. This improves response quality and reduces workload across the support team. Training also helps maintain consistency in how customer issues are handled.
Proactive Customer Communication
Proactive communication reduces incoming support tickets by informing customers before issues arise. Teams can send alerts, update status pages, and provide in app notifications ahead of known events.
Customers who receive timely updates are more likely to find answers without contacting support. This reduces pressure on customer service teams and improves overall support efficiency. Proactive communication also builds trust by keeping customers informed.
Measure Experience Improvements
Forecasting supports measurable improvements in customer experience. Teams can track metrics such as customer satisfaction, ticket resolution time, and abandonment rates to evaluate performance.
Analyzing support ticket volume alongside these metrics helps teams understand the impact of forecasting. Improvements in response time and service quality demonstrate how forecasting contributes to better customer interactions and long term customer satisfaction.
When To Align Ticket Volume Forecasts With Broader Business Planning
Modern ticketing software and best practice guides show that ticket volume forecasting plays a critical role beyond support operations. It connects directly with finance, hiring, and product planning decisions. When teams align forecasts with broader business planning, they improve resource allocation, reduce risks, and create a balanced approach to managing growth and demand.
Align Forecasts With Financial Planning Cycles
Support leaders must align forecasting support volume with financial planning timelines. During annual budgeting or quarterly reviews, projected support ticket volume helps finance teams estimate operational costs and staffing needs.
Forecasts also act as an early warning system for potential cost increases. When support volume rises, businesses can prepare for higher expenses related to staffing, tools, or outsourcing. Sharing forecasts with key stakeholders ensures that financial plans reflect real support demand and avoid unexpected budget gaps.
Plan Staffing And Resource Allocation
Accurate forecasts help teams plan staffing needs and maintain proper staffing levels across support operations. By understanding expected support ticket volume, teams can calculate agent capacity and adjust hiring plans accordingly.
Better resource allocation ensures that support teams can handle incoming tickets without delays, even during winter ticket spikes and seasonal surges. Organizations can also adopt a balanced approach by combining full time staff, temporary agents, and ticket automation software tools. This flexibility helps teams maintain service quality even during demand spikes.
Support Product And Operational Decisions
Ticket volume forecasts provide valuable insights for product and operational teams. Rising support ticket volume may indicate usability issues, onboarding gaps, or recurring technical problems.
Instead of increasing support headcount, companies can invest in product improvements or process changes. For example, implementing a modern ticketing system with strong onboarding support may reduce support tickets over time. This approach improves efficiency while lowering long term support costs.
Present Forecast Scenarios For Strategic Planning
Organizations benefit from creating multiple forecast scenarios based on growth expectations. Teams can compare scenarios such as baseline projections, aggressive growth, or conservative estimates for a specific time period.
Comparing ticket volume across these scenarios helps leadership make informed decisions about hiring, budgeting, and operational planning. Aligning forecasts with broader business goals ensures that support teams remain prepared while maintaining consistent service quality across all periods.
Common Ticket Volume Forecasting Mistakes To Avoid
Forecasting support demand helps teams plan ahead, but poor execution can reduce accuracy and create operational risks. Many teams rely on incomplete data or outdated methods, which leads to unreliable forecasts and inefficient planning. Avoiding these mistakes ensures better forecast accuracy and streamlined support with a smarter help desk platform.
Using Too Little Historical Data
Limited historical data creates weak forecasting models. When teams rely on short timeframes, such as 60 days of support tickets, they risk overreacting to temporary spikes like outages or product issues.
Accurate forecasting requires analyzing historical ticket data across a longer time period, ideally 12 months or more, within a centralized ticketing software platform. This approach helps teams understand the total number of tickets expected under normal conditions. Using broader datasets also improves the ability to analyze trends and predict future support volume with higher confidence.
Ignoring Seasonal Patterns
Seasonal fluctuations significantly impact ticket volume forecasting. Many businesses experience predictable increases during holidays, product renewals, or campaign periods.
Failing to account for these patterns can result in large forecasting errors. Comparing ticket volume across the same time period in previous years helps teams identify trends and adjust forecasts accordingly. Incorporating seasonal fluctuations improves forecast accuracy and ensures better preparation for peak periods.
Forecasting In Isolation
Forecasting without collaboration creates blind spots. Support teams often miss critical inputs when they work independently from other departments.
Customer service teams should collaborate with product, marketing, and operations teams to gather insights that influence support volume. Inputs such as product launches, marketing campaigns, seasonal surges like winter issues that break ticket systems, and technical problems can impact customer interactions and ticket spikes. Cross functional collaboration helps teams analyze trends and build more reliable forecasts.
Over Reliance On Simple Averages
Simple averages provide a basic forecasting method but fail in dynamic environments. Growing businesses often experience changing demand patterns that averages cannot capture.
Teams should use more advanced approaches such as moving averages, weighted models, and automated ticket management software, alongside tools like Google Analytics to analyze support data. These methods consider changing trends, customer behavior, and transaction count variations. Using advanced techniques leads to more accurate forecasts and better planning.
Not Updating Forecasts Regularly
Forecasting is not a one time process. Teams that fail to update forecasts regularly lose accuracy over time. Changes in customer behavior, product updates, and external factors quickly affect support volume.
Regular updates help teams respond to changes and maintain accurate forecasts. Daily or weekly schedule, teams should review data, adjust projections, and refine models. Continuous updates ensure support teams can plan effectively, reduce risks, and maintain consistent service quality.
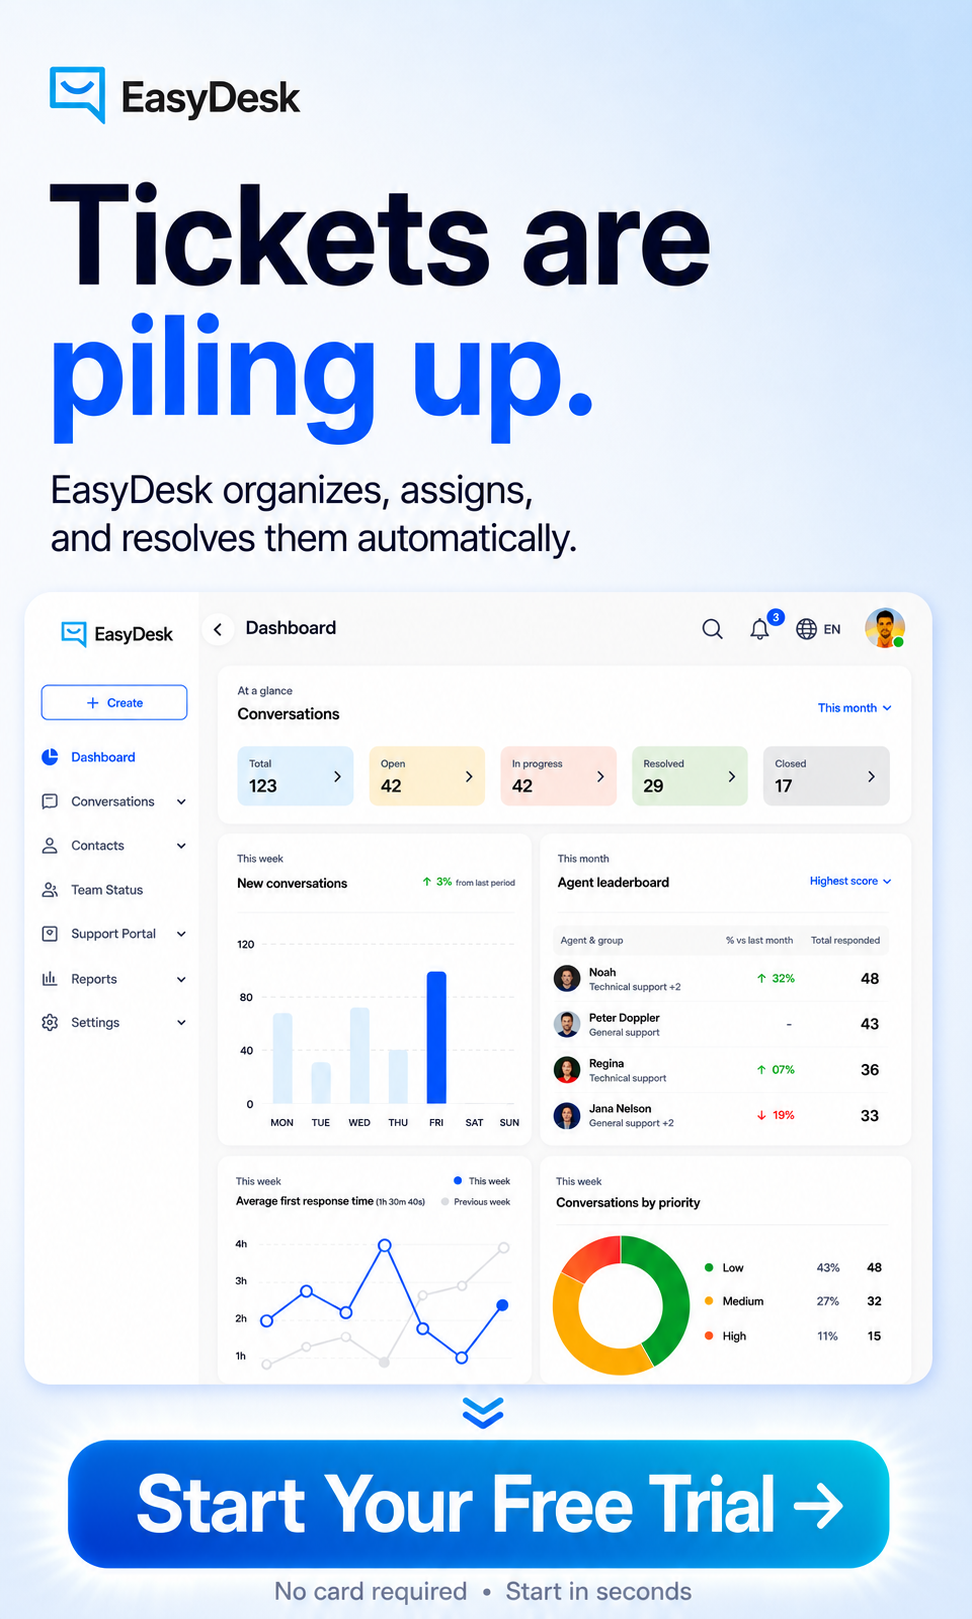
How EasyDesk Helps Teams Forecast Ticket Volume
EasyDesk helpdesk ticketing software improves ticket volume forecasting by combining real-time data with structured support operations. It analyzes historical patterns, customer interactions, and support ticket volume to deliver accurate forecasts. This helps teams plan and maintain service quality during demand spikes.
The platform uses smart automation, including an answer bot, to handle repetitive queries and ensure rapid response during peak periods. By tracking metrics like ticket ratio and conversion rate, teams gain deeper insights into managing support tickets efficiently and overall performance.
EasyDesk, as a leading ticket management system, also connects forecasting with business outcomes such as revenue forecast and average order value, helping teams align support with growth goals. On the flip side, ignoring these insights can lead to poor planning. EasyDesk provides a clear point of visibility to improve decision-making.
Frequently Asked Questions
How Far Ahead Should I Forecast Ticket Volume For My Support Team?
Use a layered approach. Forecast 4 to 6 weeks for schedule level decisions and 6 to 12 months for headcount and budget planning. A team might forecast weekly volume for April 2026 while building a rolling 12-month outlook for the rest of 2026 and early 2027. The right horizon depends on your sales cycles and how fast your customer base is growing.
What If I Have Less Than One Year Of Historical Ticket Data?
Use what you have. Augment it with customer growth projections, product plans, and industry standards. A startup that launched in late 2025 can build a simple three-month moving average while marking assumptions clearly. Revisit the model monthly as more data becomes available.
How Do I Handle One-Off Incidents In My Ticket Volume Forecasts?
Tag outages and rare crises separately so they do not distort typical forecasts. A July 2025 outage spike should be removed from baseline models but kept for incident readiness planning. Document these events for playbooks, not for average demand calculations.
Should I Forecast Ticket Volume By Channel Or Just Overall?
Start with an overall forecast, then split by channel once data volume allows. A team forecasting 4,000 tickets for November 2026 might expect 50 percent via email, 35 percent via chat, and 15 percent via phone. Channel-level forecasting helps assign the right tool and skills to each shift.
How Often Should I Update My Ticket Volume Forecast?
Refresh medium term forecasts monthly and refine near term forecasts weekly. Review forecast versus actual tickets every Monday morning. Regular updates build trust and help you spot shifts in customer behavior before they become problems.